You always want the software you write to have great performance.
The reason isn't shocking?users look to software to quickly and efficiently handle their workload. Often times, meeting this performance requirement (whether it is explicit or implied), can be a difficult, even daunting task. Tuning an application to perform at its peak level involves a thorough understanding of the architecture and environment into which you will deploy your application. However, you can't truly begin to optimize an application's performance if you don't understand how to empirically measure that performance. From this perspective, your application must emit enough data to enable real time performance monitoring.
Imagine for a moment that a new client has commissioned you to develop a .NET component. Your client gives you fairly simple specifications for the component. Your application must process comma-separated data contained within flat-files, and insert this content into a SQL Server database. The application itself does not even need to expose a graphical user interface?a simple console application will suffice. Beyond these very basic instructions, the client also imparts this golden nugget of information: Your component must process over 1,000 transactions per second.
Although the records loaded / sec counter represents an average value over time, you don't need to write any other code. The counter handles averaging and other calculations internally.
How would you go about proactively publishing enough empirical data from your component so that, at the end of the day, you can accurately address the question of application performance? The answer?use custom performance counters.
What Are Performance Counters?
Performance counters are discrete sets of data published by an executing application, service, or operating system process. Windows 2000, Windows XP, and Windows Server 2003 intrinsically support counters. They exist for the express purpose of diagnosing and analyzing throughput, bottlenecks, and so on.
Performance data is organized according to objects, counters, and instances. Objects represent the application or process that publishes the performance data. A counter is the actual measurement point. You use an instance to further delineate processes. Instances are optional.
Data is exposed for inspection via the Windows Performance Monitor console (Figure 1). This interface allows you to select specific counter instances to view graphically or log to a file.
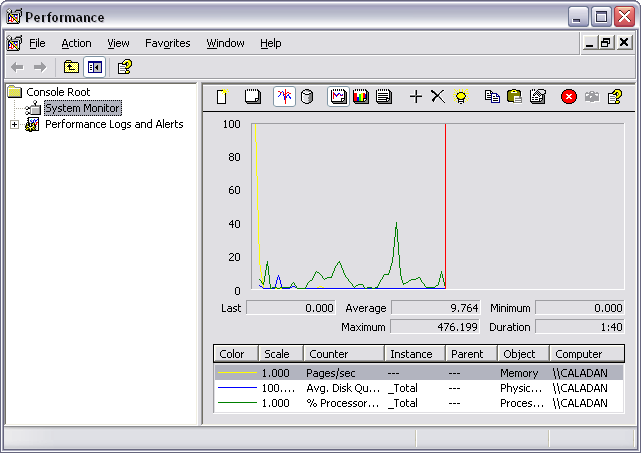
You can see that all of the plumbing is in place to monitor and view performance counters. Now let's discuss how to publish performance data from within your application.
Creating Performance Counters
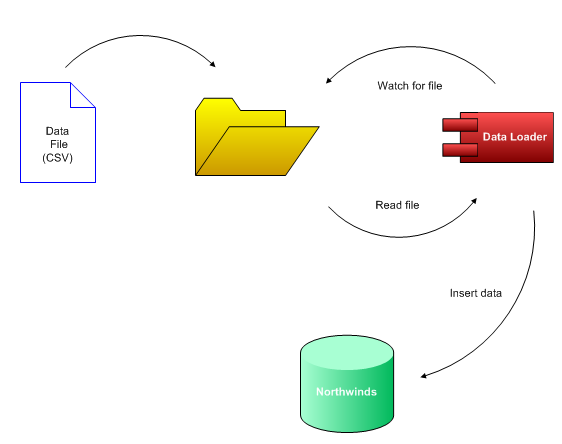
Your solution could take many different forms depending on the actual attributes of the system you want to develop. To set the stage a bit, consider a console application tasked with inserting rows into the Products table in the Northwind database. The data will arrive in the form of a CSV file that gets dropped into a pre-determined directory. The console application merely has to read each line in the file and copy its contents over verbatim to the Products table?as fast as it possibly can.
By leveraging performance counters in your applications, you can generate an accurate view of your application's performance levels, whether during the construction phase or after deployment into production.
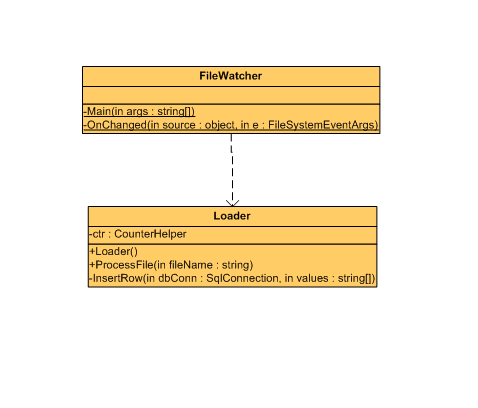
Figure 2 and Figure 3 show one possible design for this application. The FileWatcher class watches a specific file system directory. When a file arrives there, FileWatcher passes the filename to the Loader class, which will establish the database connection, read the file in line by line, and insert the data into the Northwind database.
To add performance data to this application, you must first identify the data that will enable useful performance analysis. Potential statistics useful for performance analysis might include:
Other possibilities include: percentage of errors to successful inserts, total execution time per file, average records per file, and so on. The three statistics listed above provides a good enough basis to use for exploring performance counters.
With the different counters identified, let's create them. You can add performance counters to the current inventory in one of three ways. You can add them programmatically at run-time, you can add them via an install action as part of a setup package, or you can add them via the Visual Studio .NET Server Explorer. In this article, we'll concentrate on creating counters using Server Explorer, and we'll also take a look at what it takes to create counters at run-time. Note that the Standard Edition of Visual Studio .NET does not ship with Server Explorer.
Creating Performance Counters with Server Explorer
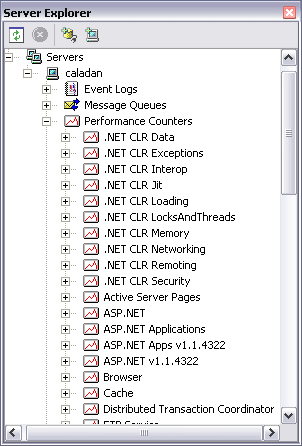
To create your set of counters using Server Explorer, fire up a version of Visual Studio .NET that ships with Server Explorer (Enterprise Architect, Enterprise Developer, or Professional). Make Server Explorer visible. (Press Ctrl-Alt-S to make it active if it isn't currently being displayed.) Under the Servers node, locate and expand the tree for the computer that will host the performance counters. Expand the Performance Counters node. Figure 4 shows the performance counters configured on a machine.
To add your own performance counter, you will first create a new category. A category is typically the name of the application that will publish the performance data, although you may wish to use multiple categories for larger systems. Right-click on the Performance Counters node and select Create New Category. This will launch the Performance Counter Builder dialog box shown in Figure 5.
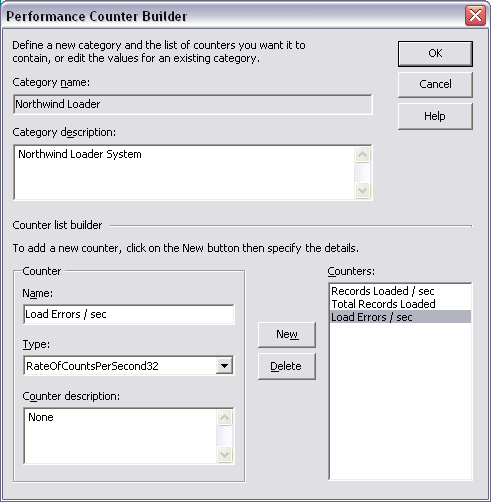
To follow along with our Northwind data loader sample, type Northwinds Data Loader as the Category name then click New to add a new counter. Working through the list of previously identified counters, enter the name, type, and description for each one, filling in the information that you see in Table 1. Note that there is a slight disconnect in the nomenclature here. A category is the same thing as an “object.” (Refer above where we discussed the organization of performance counters.)
Click OK?and you're done. You've created the performance counters and registered them on your machine.
Creating Performance Counters Programmatically
To create your performance counters in code, you will use a series of classes from the System.Diagnostics namespace. Table 2 summarizes these classes. Let's start off with the CounterCreationDataCollection class. This collection class holds CounterCreationData instances; these physically represent the custom counters. Therefore, after instantiating a CounterCreateDataCollection object, you will then create your counters by building CounterCreateData objects and adding them to the CounterCreationDataCollection instance. The following snippet shows the code necessary to create the records loaded / second counter.
// C#
// First create the CounterCreationDataCollection
// object
counters = new CounterCreationDataCollection();

// Create the counter instances to add to the
// collection...
CounterCreationData ctr =
  new CounterCreationData();

// Set the counter's properties
ctr.CounterName = "Records Loaded / sec";
ctr.CounterType =
  PerformanceCounterType.RateOfCountsPerSecond32;

// Add the counter to the collection
counters.Add(ctr);
After you have built up your collection of counters, you must create them in a particular category using the PerformanceCounterCategory class. This class exposes a static/shared member called Create. After passing the category name, category help topic, and the CounterCollectionData instance in to the Create method, the counter(s) will be registered on the local computer. In addition to creating the counter, the Create method will also create the category if it doesn't currently exist on the target machine.
// Create the counter
PerformanceCounterCategory.Create
  ("Northwind Data Loader",
  "",
  counters);
Publishing Performance Data
The counters you created can now accept data. Let's add the publishing code to the data loader. Figure 3 shows the basic architecture of the Northwinds data loader component. We will place all of the important activity, from a performance perspective, inside the Loader class. Through its ProcessFile method, the Loader class opens the data file and sends each line through to a SqlCommand object (via the private InsertRow routine) that performs the insert into the Products table in the Northwind database. In the following pseudo-code for the record insertion process, it becomes clearer exactly where you should publish the performance counter data.
public void ProcessFile()
{
   // Open the file
   // Loop: read in each line
   //    Parse the file line
   //    Try: Insert the values
   //         Update perf counters
   //         Continue loop
   //    Catch:
   //         Update per counters
   //         Continue loop
   // End loop
   // Close the file
}
There are really two important points within the source: when a record is successfully inserted, and when an exception is encountered during a record insert.
With the code sites located, you can now focus on publishing the performance data. Writing to performance counters involves using the PerformanceCounter class from the System.Diagnostics namespace. The PerformanceCounter class represents a registered instance of a performance counter. Performance counters are uniquely identified by name; the x class allows you to identify the counter instance you want to work with through its CounterName property. You will also identify the counter through its category name (via the CategoryName property) and through the machine name that is hosting the counter (via the MachineName property). This code will create a ‘connection’ to our previously created records loaded / sec counter.
// Configure the loadsPerSec counter
loadsPerSec = new PerformanceCounter();

// Set the category name
loadsPerSec.CategoryName = "Northwind Loader";
// Set the counter name
loadsPerSec.CounterName = "Records Loaded / sec";

// Set the machine name
loadsPerSec.MachineName = ".";
You will also set the ReadOnly property (to indicate that you want to write into the counter), and the RawValue property. The code uses the RawValue property to directly assign a value to the counter. In the code snippet below, I use RawValue to initialize the counter to 0.
loadsPerSec.ReadOnly = false;
loadsPerSec.RawValue = 0;
You can create handles to the other counters in a similar fashion. Once you have the handle to a counter, to record a newly loaded record you just need to call the PerformanceCounter.Increment() method. This method will increment the counter's raw value by 1. Although the records loaded / sec counter represents an average value over time, you don't need to write any other code. The counter handles averaging and other calculations internally.
loadsPerSec.Increment();
Listing 1 shows the completed Loader class. To simplify the code a bit, I created a CounterHelper class (Listing 2). I use CounterHelper to create the PerformanceCounter objects and expose three public methods that the Loader class uses to increment those counters: IncLoadsPerSec, IncErrorsPerSec, and IncTotalLoaded.
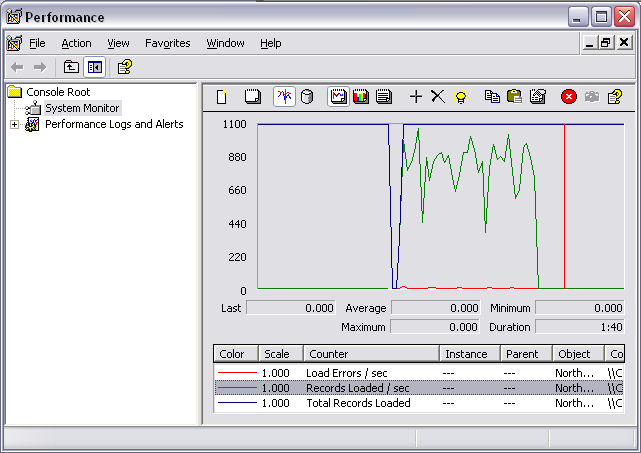
To see the performance counters in action, run the Windows Performance Monitor and then run the data loader application. You begin the load process by dropping a test file into the loader's data directory. Figure 6 shows the performance counters during the load of a file with approximately 31,000 records. Some records contained errors (as shown by the errors / sec counter).
By leveraging performance counters in your applications, you can generate an accurate view of your application's performance levels, whether during the construction phase or after deployment into production. Accompanying source code for this article, in both Visual Basic and C#, is available at http://www.brilliantstorm.com/.
Listing 1: The Northwinds Loader class, with performance counter code added
using System;
using System.IO;
using System.Data.SqlClient;
using System.Text;
using System.Threading;

namespace Northwinds.DataLoader
{
   /// <summary>
   /// Enables you to load flat files containing
   /// product data into the Products table in
   /// the Northwind database.
   /// </summary>
   public class Loader
   {
      // Connection string to access the Northwind
      // database
      const string NW_CONN_STR =
         "Initial Catalog=Northwind;"+
         "Data Source=localhost;";

      CounterHelper ctr;

      public Loader()
      {
         ctr = new CounterHelper();
      }

      public void ProcessFile(string fileName)
      {
         // Open the database connection
         SqlConnection conn =
            new SqlConnection(NW_CONN_STR);

         conn.Open();

         // Use a StreamReader to read the file in
         // line by line
         using (StreamReader rdr =
                   new StreamReader(fileName))
         {
            string line;

            while ((line = rdr.ReadLine()) != null)
            {
               // Create array of elements (these
               // are comma-separated values)
               string[] values = line.Split(',');

               // Try to do the record insert
               try
               {
                  // We are only expecting 9 columns;
                  // if we have more or less, the
                  // line is invalid.
                  // Throw an exception. Move to next
                  // line.
                  int ub =
                     values.GetUpperBound(0);

                  if (ub != 8)
                  {
                     throw new ApplicationException
                        ("Invalid line: "+
                         "column mismatch");
                  }

                  // Insert the data
                  InsertRow(conn, values);

                  // Increment the 'loads / sec'
                  // counter here...
                  ctr.IncLoadsPerSec();

                  // Increment the 'total loaded'
                  // counter here...
                  ctr.IncTotalLoaded();
               }

               catch (Exception ex)
               {
                  // Increment the 'errors / sec'
                  // counter here...
                  ctr.IncErrorsPerSec();
               }
            }
         }
      }

      // Loads a row into the products table of the
      // Northwind database
      private void InsertRow(SqlConnection dbConn,
         string[] values)
      {
         // Brute-force build the insert query
         StringBuilder qry = new StringBuilder("");

         qry.Append("INSERT INTO Products (");
         qry.Append("ProductName, ");
         qry.Append("SupplierId, CategoryId, ");
         qry.Append("QuantityPerUnit, UnitPrice, ");
         qry.Append("UnitsInStock, UnitsOnOrder, ");
         qry.Append("ReorderLevel, Discontinued) ");
         qry.Append("Values('");
         qry.Append(values[0]);	// prod name
         qry.Append("', ");
         qry.Append(values[1]);	// supp id
         qry.Append(", ");
         qry.Append(values[2]);	// ctgy id
         qry.Append(", '");
         qry.Append(values[3]);	// qty / unit
         qry.Append("', ");
         qry.Append(values[4]);	// unit price
         qry.Append(", ");
         qry.Append(values[5]);	// units in stock
         qry.Append(", ");
         qry.Append(values[6]);	// units on order
         qry.Append(", ");
         qry.Append(values[7]);	// reorder level
         qry.Append(", ");
         qry.Append(values[8]);	// discontinued
         qry.Append(")");

         // Create the command object
         SqlCommand cmd =
            new SqlCommand(qry.ToString());

         cmd.Connection = dbConn;

         // Execute the insert command
         cmd.ExecuteNonQuery();
      }
   }
}
Listing 2: The CounterHelper class grabs handles to the performance counters and increments their values
using System;
using System.Diagnostics;

namespace Northwinds.DataLoader
{
   /// <summary>
   /// Simple helper class used by the Loader
   /// object to increment the three performance
   /// counters used by the DataLoader application
   /// </summary>
   public class CounterHelper
   {
      PerformanceCounter ctrLoads;
      PerformanceCounter ctrErrors;
      PerformanceCounter ctrLoaded;

      public CounterHelper()
      {
         // Configure the loads / sec counter
         ctrLoads = new PerformanceCounter();

         // Set the category name
         ctrLoads.CategoryName = "Northwind Loader";
         ctrLoads.CounterName = "Records Loaded / sec";
         ctrLoads.MachineName = ".";
         ctrLoads.ReadOnly = false;
         ctrLoads.RawValue = 0;

         // Configure the errors / sec counter
         ctrErrors = new PerformanceCounter();

         // Set the category name
         ctrErrors.CategoryName = "Northwind Loader";
         ctrErrors.CounterName = "Load Errors / sec";
         ctrErrors.MachineName = ".";
         ctrErrors.ReadOnly = false;
         ctrErrors.RawValue = 0;

         // Configure the errors / sec counter
         ctrLoaded = new PerformanceCounter();

         // Set the category name
         ctrLoaded.CategoryName = "Northwind Loader";
         ctrLoaded.CounterName =
             "Total Records Loaded";
         ctrLoaded.MachineName = ".";
         ctrLoaded.ReadOnly = false;
         ctrLoaded.RawValue = 0;
      }

      public void IncLoadsPerSec()
      {
         ctrLoads.Increment();
      }

      public void IncErrorsPerSec()
      {
         ctrErrors.Increment();
      }

      public void IncTotalLoaded()
      {
         ctrLoaded.Increment();
      }
   }
}
Table 1: For the Northwinds DataLoader class, we are interested in tracking statistics across three different counters.
| Counter | Type |
|---|---|
| Load Errors / sec | RateOfCountsPerSecond32 |
| Records Loaded / sec | RateOfCountersPerSecond32 |
| Total Records Loaded | NumberOfItems32 |


