I'll show you how to build tools to address common reporting requirements for your business using Crystal Reports with .NET.
I'll also show you how you can use graphics and multiple levels of detail to summarize large amounts of information and efficiently present it to business users and decision makers. Users of your company data will be the first to determine that an otherwise quality software solution is incomplete if it fails to present data in a way they can easily interpret. Although Crystal Reports provides many outstanding capabilities to help build and deliver sophisticated presentation output, I'll present a proven collection of reusable practices and methodologies that you can apply across most reporting projects to add that extra sparkle to your solutions.
Beginning with the End in Mind
In the Nov/Dec issue of CoDe Magazine, I began by asking the question: what do I intend to achieve by the end of the article? This article is no different. By the time I'm finished, I'll present to you a development project in C# and a reusable set of class libraries to demonstrate the following:
The reports for this development project were created with Crystal Reports 10. Although much of the content of this article also applies to the version of Crystal Reports that comes with Visual Studio .NET, the latest version of Crystal Reports is required for working with the download project.
Building a quality report means more than just the capabilities of the tool: it also means defining the layout, query and data requirements, identifying any special calculations and business rules, adhering to output formatting guidelines, etc.
Once again, borrowing from the theme of Van Amsterdam's bakery, I have thirteen productivity tips to offer you: the Baker's Dozen.
The Development Project
Figure 1 shows the development solution I'll use to demonstrate reporting functionality. It consists of two projects. This first is a test project (CrystalReportsMainForm) with several forms for the different test reports that you'll build. The second is a generic library (ccCrystalTools) of classes to help you get productive with Crystal Reports. Figure 2 shows the main driver form that lists all of the test forms/reports referenced in this article. The entire development project can be found in the download area of my Web site at www.commongroundsolutions.net.
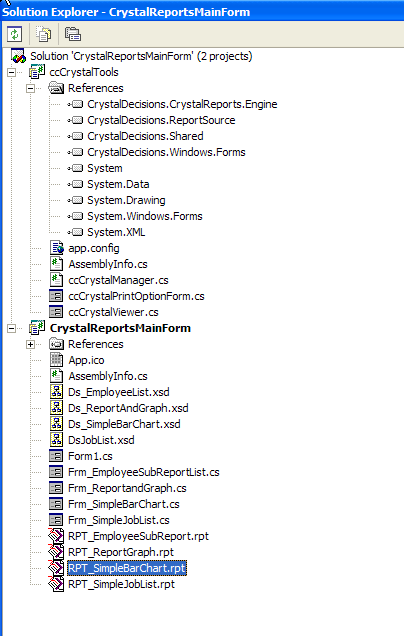
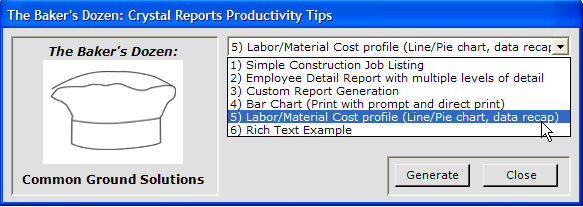
Although these are test projects, they are intended to demonstrate common (and not so common) reporting requirements.
Tip 1: The First Report
Building a quality report means more than just understanding the capabilities of the reporting tool: it also means defining the layout, queries, and data requirements, identifying any special calculations and business rules, adhering to output formatting guidelines, etc. I've built over two hundred reports over the last fifteen years (some easier than others), and in practically every case, the following needed to be determined and identified:
- The report content (including calculations, subtotals, etc.)
- Whether the layout conforms to any organization standards (font, margins, annotations, etc.)
- Run-time options for the report
- Report visibility (which user types were authorized to run the report, and if so which measures were they allowed to see)
- Data schema used for the report, and how the data will be retrieved
- How the report should be presented (preview first, or directly to the printer, etc.)
I certainly can't cover all of these in one article, but I can cover the specific steps with respect to Crystal Reports. Assume you've been given the requirements to produce a very simple report: a list of construction jobs and their bid amounts. You'll build two tables for the report: company header information and the job list. The example and data themselves are meaningless, but are used to demonstrate the construction of a simple report.
The RunReport function takes care of setting the data source for the report and any existing subreports; you don't need to specify the table order, subreport names, etc.
Before you build the report layout in Crystal Reports, you must define a data schema to be used with the report. You will build an XML schema definition by creating a typed DataSet using Visual Studio .NET. Figure 3 shows the DataSet (DS_JobList) containing the two data tables that you'll pass on to Crystal Reports as the report data definition.
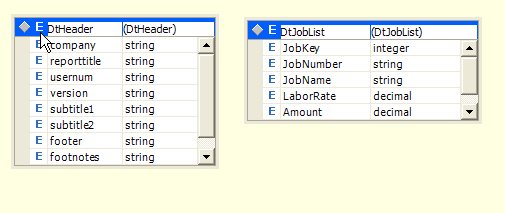
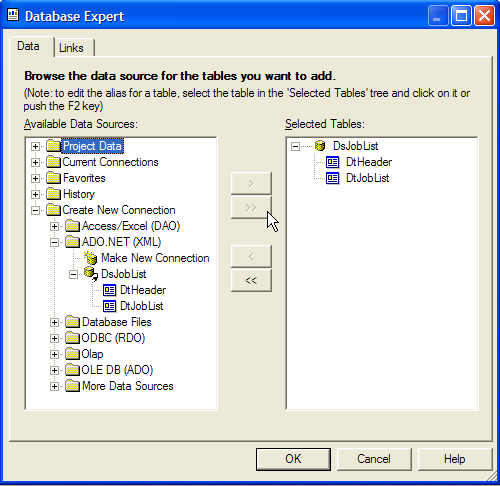
After you save the XML schema (DS_JobList.XSD), you can open up Crystal Reports and start a new report. You have the option to either use the report wizard or create a blank report. I usually choose the second option. Crystal Reports then prompts you to specify the data source. Choose Create New Connection and expand the ADO.NET (XML) option. Crystal Reports then allows you to specify the XSD file that you created in Visual Studio .NET. After you select the XSD, you can select all of the datatables from the XSD (Figure 4).
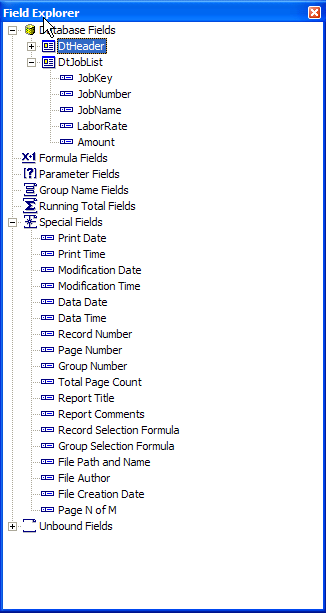
Once you've supplied the data schema to the report, you can drag and drop the data elements onto the report body, according to your needs. By clicking View...Field Explorer, the Crystal Reports Field Explorer appears (Figure 5). The Field Explorer shows all of the available data elements, as well as valuable system data elements that you can use on a report (page X of Y, print date/time, etc.). After you design the report, you'll save it as RPT_JobList.RPT.
It's beyond the scope of this article to talk about all the great functions in Crystal Reports for building reports. Crystal Reports 10, in particular, has added some new power designer tools that make advanced report creation even easier. A good reference is Special Edition Using Crystal Reports 10, by Neil Fitzgerald, ISBN 0789731134.
Tip 2: Showing the Report Using the New Toolkit
Now that you've saved the report, you want to generate it from the application using the most recent job data. For demonstration purposes, you'll create sample data, rather than pulling the data from a back-end data source.
First, you need to add the report to your project as a typed report. The expanded development project in Figure 1 shows several Crystal Reports files in the project. By including reports in the project that will eventually be compiled into a DLL, you don't need to distribute the reports. You can reference a report and create a new instance of it just the way you would any other class, as follows:
RPT_JobListing oReport = new
   RPT_JobListing();
Second, you need to populate the typed DataSet definition with actual data. The sample project builds the necessary data for the report. So you need to push this data into the report and load the report.
Those new to Crystal Reports sometimes struggle with the exact syntax for pushing data into Crystal Reports, and even struggle a little with the process of displaying the report. Fortunately, the ccCrystalTools project provides several reusable functions to simplify these very tasks. Throughout the article I'll reference different functions that ccCrystalTools provides. In this case, the first function is perhaps the most powerful: after you populate the dataset, you can display the report on the screen with three lines of code:
RPT_JobListing oReport = new
                RPT_JobListing();

ccCrystalTools.ccCrystalManager oCrystal = new
               ccCrystalTools.ccCrystalManager();

oCrystal.RunReport(DsMyData, oReport,
               "Preview Title",  "PREVIEW");
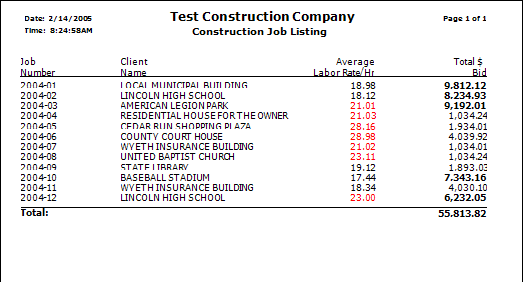
That's all there is to it! The function takes care of correctly pushing the dataset into the report. You'll see your report displayed in the standard Crystal Reports preview window (Figure 6), along with the Crystal Reports toolbar to navigate through the report pages, print, export, etc. Note that some of the data is in bold and some in red: those are examples of formatting appearance at runtime through report formulas. I'll discuss them in Tip #7. I'll get into other options with the function a little later.
Those who have written code to specify a report's datasource know that Crystal Reports is strict about receiving datatables in the same order they were defined at runtime. The RunReport function takes care of that?all you need to do is pass a dataset with the same table names that were used at report design time, and the function will take care of the rest. The RunReport function does so by using an internal method called SetData. This method scans through both the DataSet as well as the tables in the report's Database object, like so:
int nTableCtr = 0;
// scan each table object in report, match it up
// to the same datatable in the Dataset to be used
foreach(Table oTable in oReport.Database.Tables) {
   foreach(DataTable Dt in DsReportData.Tables)
      if(Dt.TableName.ToString().ToUpper()
         ==oTable.Name.ToString().ToUpper())
                  oReport.Database.Tables
                    [nTableCtr].SetDataSource(Dt);
    nTableCtr++;
}
Later in this article, I'll discuss how you can use this same function with a report containing one or more subreports.
Tip 3: A Reusable Print Dialog
The previous tip shows how you can launch a Crystal Reports Preview form with minimal code. However, sometimes you may wish to print directly to the printer, without previewing. To print a report directly to the current Windows default printer, simply change the final parameter in RunReport() to PRINT or PRINTER (they both do the same thing). This parameter is particularly helpful if you're building a print process that doesn't require user prompts.
Like any good user interface, report output should look consistent.
Of course, you may wish to set print options prior to printing. The Crystal Reports preview toolbar has a print option button that provides a print options tab. However, I've heard people ask how to provide the print options dialog box without needing to go through the preview screen.
The tool ccCrystalTools provides a Print Options form class (ccCrystalPrintOptionsForm) that your code can call just prior to printing a report:
ccCrystalTools.ccCrystalManager oCrystal = new
               ccCrystalTools.ccCrystalManager()

ccCrystalTools.ccCrystalPrintOptionForm oPrintForm
  = new ccCrystalTools.ccCrystalPrintOptionForm();

oPrintForm.ShowDialog();
if(oPrintForm.DialogResult==DialogResult.OK)
   oCrystal.RunReport(DsMyData, oReport,
      "","PRINT");
The Print Options form contains many of the standard runtime print options, such as the printer to use, number of copies, page range, etc.
The print form ccCrystalPrintOptionsForm itself is fairly simple and allows users to select among the list of available printers and prompts to indicate number of copies, page range, etc. These selections are bound to properties in ccCrystalManager. Note the drop-down list of available printers: another common question I've heard is how to obtain a list of available printers. The System.Drawing.Printing namespace provides a PrinterSettings class including a collection of installed printers. You can scan through that collection to populate the printer selection drop-down list:
foreach(String cPrinter in
        PrinterSettings.InstalledPrinters)
   cboPrinters.Items.Add(cPrinter);
There's one more issue to discuss as part of this tip: Suppose you want to show the current Windows default printer as the default drop-down value, but it may not be the first one in the list. You can easily determine the current Windows default printer by starting a new Windows print document, and retrieving the PrinterName from the print document's printer settings:
PrintDocument prtdoc = new PrintDocument();
string strDefaultPrinter =
 prtdoc.PrinterSettings.PrinterName;
Once you've determined the name of the default printer, you can make that the default entry in the printer drop-down list selection. The Crystal Manager (ccCrystalManager) sets the Report object's printer name to the name of the selected printer, just before issuing the final call to print the report.
oReport.PrintOptions.PrinterName =
     this.cPrinterName;

oReport.PrintToPrinter(this.nCopies,
   this.lCollate,this.nStartPage,this.nEndPage);
Note that the properties specified above are properties bound to the print options in ccCrystalPrintOptionsForm.
Tip 4: Exporting Reports
Crystal Reports supports export of reports to different output formats. You can use the RunReport method in ccCrystalManager to export simply by passing PDF, WORD, or EXCEL as a parameter, and providing the name of the output file as an additional parameter:
oCrystal.RunReport(DsMyData, oReport, "",
      "PDF","MyPDF.PDF");
Crystal Report's export capabilities have improved dramatically over the years. The export to Word and Excel feature retains a very high percentage of the report's format, and the export to PDF is even better. As PDF has become a popular means of distributing output electronically, this makes the export capability even more attractive in an enterprise environment.
Tip 5: Multiple Levels of Detail (Subreports)
Crystal Reports allows you to produce reports with multiple levels of detail. A simple but demonstrative example is Figure 7, an Employee Report that displays two different levels of detail: weekly hours and employee notes.
As with the first report you created, you need to define the necessary schema in the Visual Studio .NET dataset designer. For this example, you need four datatables: the standard company header table, a parent employee ID/Name table, and two related child tables (on the employee ID) for weekly hours worked and employee notes.
Create the report and specify the XML schema definition as the data source. Note that after supplying the XML schema, you should verify the visual links between related datatables by clicking **Database...Database Expert...Links. **
You need to perform some additional tasks to produce the multiple levels of detail. First, you need to insert a group on the Employee ID from the Employee table. This is done by specifying the Insert...Group column as the key.
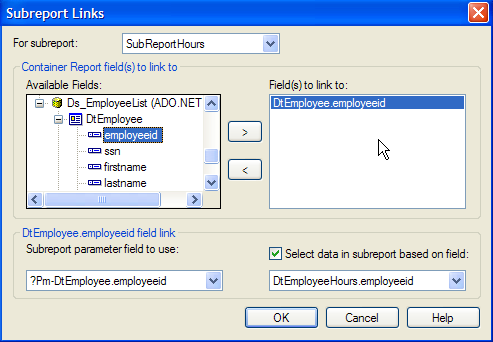
Next, you need to insert two subreport definitions for hours worked and notes. These subreports will be linked by employee ID so that only the related rows for hours and notes will display for each employee. This is done by doing the following:
- Click Insert...SubReport.
- Specify a unique name for each subreport (SubReportHours and SubReportNotes) and then click Report Wizard.
- Identify the data table(s) to be used in each subreport (the datatable for employee hours and the datatable for employee notes).
- Go into each subreport and drag the necessary columns from the field explorer.
- Finally (and most importantly), go back to the main report, right-click on the subreport placeholder, and select Change Subreport Links. This ensures that hours and notes are only displayed for the group definition (employeeid). Select EmployeeID from the list of columns (Figure 7).
After saving the report, you can add it to your Visual Studio .NET project and then run the report using the same command you used in the first report:
RPT_EmployeeSubReport oReport = new
                RPT_EmployeeSubReport();

ccCrystalTools.ccCrystalManager oCrystal = new
               ccCrystalTools.ccCrystalManager();

oCrystal.RunReport(DsEmployeeList, oReport,
   "Employee Listing", "PREVIEW");
Note that you don't need to specify any of the subreports when you generate the Employee Report with RunReport. This function automatically searches the report object for any subreport definitions, and performs the necessary calls to SetDataSource based on the dataset you provided to the function.
Earlier I covered the internal method SetData, which scans through a report's database object and matches up datatables to the dataset that you provide. RunReport actually makes up to two sets of calls to SetData: one for the main report object and a second for any subreports:
foreach(ReportDocument oSubReport in
oReport.Subreports)
            this.SetData(DsReportData,oSubReport);
So again, you never need to worry about matching up subreport names based on how you designed them: RunReport takes care of it for you!
Tip 6: Custom Reporting
Business Objects produces other tools (such as Crystal Info) that allow end users to generate their own reports. Crystal Reports doesn't provide any out of the box capabilities for users to define their own reports, but you can provide users with a certain level of empowerment (in a controlled environment). The technique isn't specific to Crystal Reports. As an example, suppose your application has six measures that are used to analyze a sales account's performance: profit margin, profit dollars, total costs, total gross dollars, returns, and cost per unit sold. You are building a report that contains other information and only has room for three of those measures. Some may wish to see profit calculations, and others may want to see different figures. You can accommodate this requirement by doing the following:
- Develop a simple user interface for users to select up to three measures.
- Design the report's dataset to include three generic columns at the appropriate level of detail (CustomCol1 through CustomCol3).
- Include three corresponding Header Definition columns in the report's dataset to define the appropriate heading for the selected measures (as you won't know the headings at design time).
- If formatting differs for any of the three columns (some are displayed as two decimals, some as zero, etc.), you'll need to define additional Definition columns to store this type of information. You can use a Crystal Reports formula to define a particular format (decimals, alignment, etc.) using this definition column.
Tip 7: Report Formulas
Crystal Reports provides a variety of report formulas for math, financial, and string functions. The Crystal Reports formula editor also provides an English-like scripting language for a variety of purposes. Corporate power users who pull data directly from back-end data sources (like SQL Server) for reporting rely on these formulas, as they aren't working with an application tool to further synthesize data.
Building a chart in Crystal Reports is about three things: data, data, and data.
However, Crystal Report's formula capability is a little less necessary for developers, who have the ability to format the final report data through programmatic means?either by stored procedures or local data manipulation prior to report generation.
Generally speaking, the data passed on to a report should essentially mirror what is on the report; additional logic and calculations should be used judiciously. You should view reports as a presentation vehicle for the data, not as a repository for large amounts of business logic. When reports contain large amounts of formulas and calculations, those formulas and calculations create maintenance issues when application changes are made.
As a general rule of thumb, the only types of formulas you really need to use in Crystal Reports are ones that affect the report's appearance. For instance, back in the first report example, you set amount to bold if the value exceeded $5,000, and you displayed the retail labor rate in red if it exceeded $5.00. This is done by defining the following formulas for the column's Font Style and Font Color, respectively:
if  {DtJobList.Amount} > 5000 then
    crBold
else
    crRegular
if {DtJobList.AverageRate} > 5 then
    crRed
else
    crBlack
Note that in these examples, you hard-coded the thresholds. You could define these values in a definition table. (Again, reports are ALL about data!)
Tip 8: Repeatable Reporting Practices
I'd like to spend a few paragraphs on another concept that you can apply to many different reporting projects: a report style-guide.
Just like a good user interface, report output should be consistent. Some development groups build and adhere to report style guides that define conventions for attributes such as font usage and margins. I was a Tahoma man for years, I had a brief fling with Trebuchet, and these days I prefer Verdana. You and your company can use whatever font is best for you.
I generally recommend a maximum of three font sizes on a report. You might want to use 14 point for primary titles, 12 or 10 point for secondary titles, and 8 point for data. Of course, you can use bold and italics as needed. As for margins, I generally use a half inch on all sides. I realize that might make it difficult for reports with a large number of columns. But keep in mind that the output might be reproduced for a binder, manual, or some type of printed package where a very small margin might make it difficult to read. Of course, you may place greater emphasis on being able to display a large number of measures on your report, and that's fine: the point is to think through all the uses of your reports as you make decisions on these attributes.
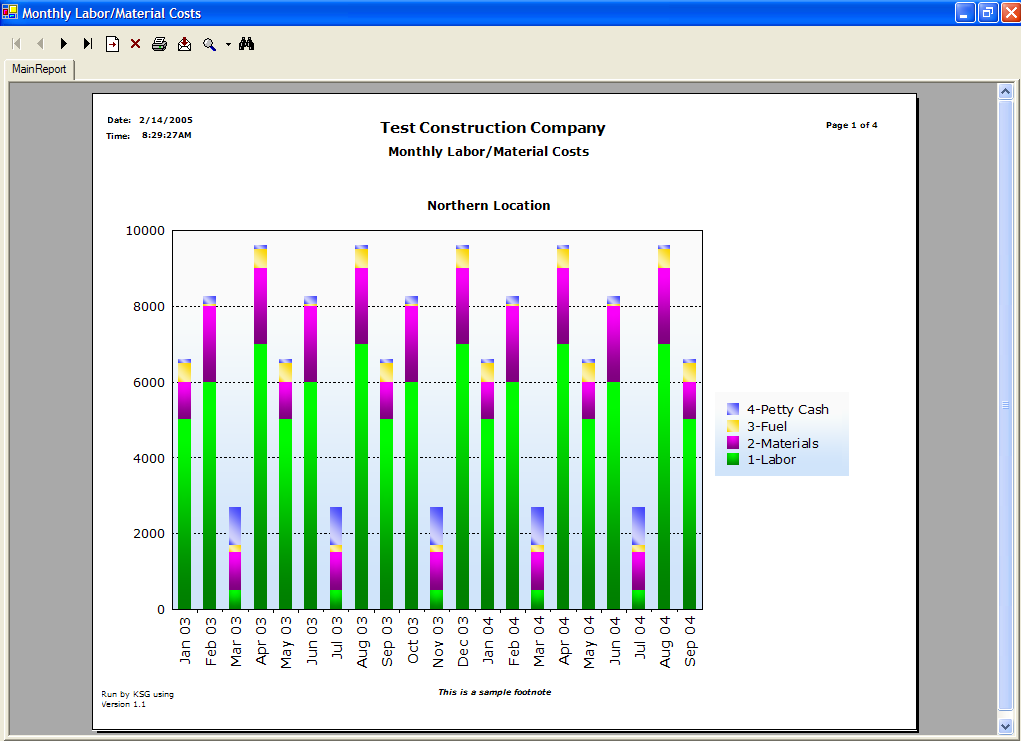
A style guide should also cover common content and placement. The bar chart in Figure 8 shows several pieces of information that you might choose to display across all reports, and their locations:
- Company name and report title
- Report sort order and any primary filter condition
- Date/Time Prepared/User who ran the report
- Company Copyright, URL, phone number
- User footnote and system-generated annotation
- Software version and page X of Y
Of course I'm just making suggestions: you want to identify the type of information you wish to display on all of your reports, and identify how/where you want to consistently present them for your application. You may not need all of these pieces of information for every reporting solution, although things like User ID and Data Source can be very helpful in troubleshooting a problem.
Let me suggest a few other things to keep in mind:
- Watch for labels and text running into each other
- Make sure you allow enough area/space for currency values
- Avoid over use of dollar signs on currency columns. I recommend that you indicate in a column heading that the column represents currency (e.g. Gross Revenue $).
Tip 9: Building a Bar Chart...It's All About Data!
Now it's time for some cool stuff! Crystal Reports provides the ability to construct several types of charts to help provide a pictorial summary of your data. The old expression is true: a picture is worth a thousand words (so long as it's a well-designed picture).
The true appeal of charting in Crystal Reports is the ability to integrate it into the report just as you would a normal subreport.
In addition to the common types of charts (bar, line, pie), you can also build area charts, Gantt charts, scatter graphs, funnel Charts, stock charts, bubble charts, and a few others. The true appeal of charting in Crystal Reports is the ability to integrate it into the report just as you would a normal subreport.
Let's work backward (beginning with the end in mind) and take a look at the type of chart you want to build. Figure 8 shows a stacked bar chart that depicts an organization's costs over the last year and a half. The report displays the cost data by location, broken out by month, and subdivided by cost category. In order to show trends from the previous year, the report uses a single horizontal line to graph the total costs for the same time period a year ago.
Building a chart in Crystal Reports is all about three things: data, data, and data. I say that partly tongue-in-cheek, because Crystal Reports needs data not only for the pictorial representation, but also needs description data for legends, x-axis descriptions, etc. Basically, the datatable for the graph needs a column (which I've called LegendType) to define the cost categories, a column (Label) to define the labels along the X-Axis (the months), and a column to store the data itself (Data).
Designing a graph is straightforward in Crystal Reports, although there are a few steps and tweaks to get the chart the way you want it. After designing the data schema, open Crystal Reports, create a new report, and point to the schema. Then create a new chart by choosing Insert...Chart. Crystal Reports presents you with a three-tab Chart Wizard dialog box.
The first tab allows you to select the type of chart. Choose Bar, and on the right side of the screen, choose the specific type of bar chart (e.g. side-by-side, stacked bar, etc.).
On the second tab, you define the data for the graph (Figure 9). You need to provide two definitions. For the first definition (the On change of label), you need to define the division and subdivision. The division for a bar chart is the X-Axis definition (each month), and the subdivision includes any groupings within each month (the cost categories). So drag the two data columns that represent the month and cost categories into the On change of section. The second definition (show value) represents the actual data that Crystal Reports will chart, so drag the data column that contains the actual numeric data into the Show value(s) section.
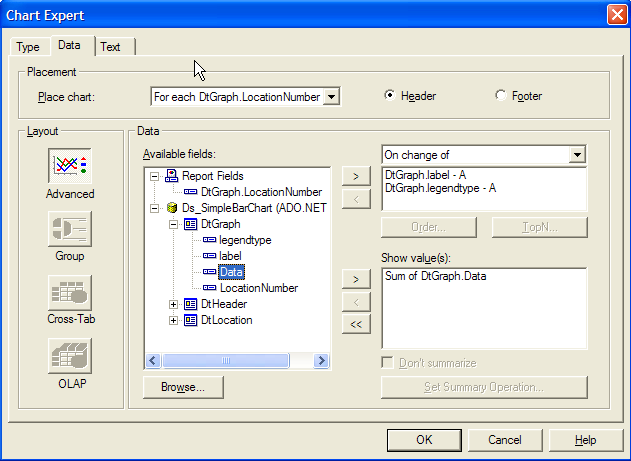
At this point, you could stop and save the graph and generate it at runtime against your data. But you have to make a few adjustments to generate a graph identical to the one in Figure 8.
- To show a legend, right-click on the graph, choose Chart Options...General, go to the Look tab, and check the checkbox for Show Legend. Note the options underneath the checkbox for the placement and appearance of the legend box.
- To define a series as a line instead of a graph (the horizontal line depicting costs for a year prior), right-click the series of that bar, choose Chart Options...Series, and change the option for Show selected series as… to a Line.
- To change the color/font/gradient for any series, label, etc., select the item, right-click, and choose Chart options...selected item.
You can check these options, and other graph options, by right-clicking on a portion of the graph. The short-cut menu provides many different options for customizing chart output.
One final point on charting: the Crystal Reports designer provides the ability to preview a report, so long as the designer has data to use. The schema definition you supplied to Crystal Reports did not contain any data; in that situation, the only way to preview a report is by a trial and error process of running it in the application. That's inefficient, so a workaround is to create an instance of the Typed DataSet in a sample program, populate the dataset with sample data, and write out the dataset to an XML file that includes the schema. You could use sample code like this:
DataSet Ds = new Ds_SimpleBarChart();
// populate Ds with data
Ds.WriteXml("GraphSchema.XML",
XmlWriteMode.WriteSchema);
When you build the chart, you can specify the XML file as the data source. That satisfies the requirements of providing a schema, and also gives Crystal Reports some data for building the graph in the designer Preview mode.
Tip 10: The Baker's Dozen Spotlight: Print Multiple Charts and a Report Band on One Page
Let's take the concept of printing a chart one step further by building a report with two charts and a detail band on a single page. Figure 10 shows a Cost Profile Report with a pie chart depicting cost by location, a line chart showing cost trends over time, and a report band showing additional monthly job labor/cost information. This report demonstrates Crystal Reports' ability to display multiple levels of data.
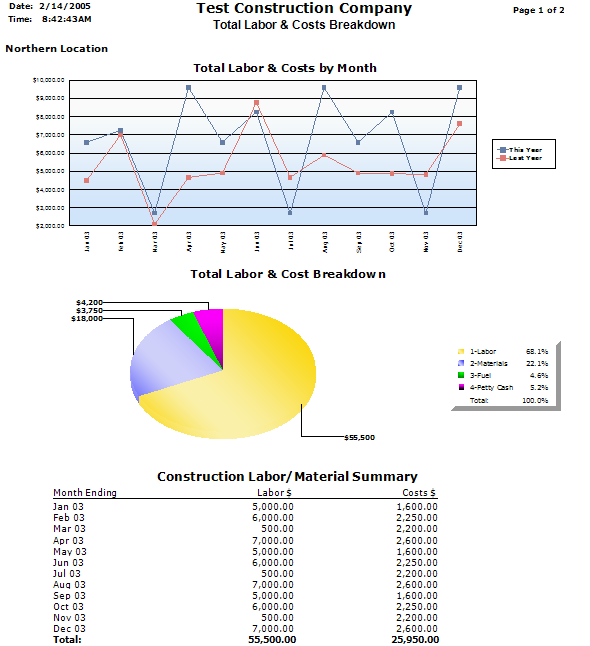
Once again, data drives the definition of the charts. The data definition for a pie chart needs two columns. The first column is the description column to annotate each slice (LocationName); this column maps to the On Change of data option in the Crystal Chart Export. The second column is the data column to be charted (CostsTY); this column maps to the Show Value data option.
The data definition for a line chart is similar to a bar chart. You need two columns to divide and subdivide the data (MonthEnding for the X-Axis and LegendType for the line series, to be mapped to the On Change of data option). You need one column for the actual data (Costs for the Show Values data option).
In the previous example, you inserted the bar chart directly into the group header that you defined in the report. Once again, the report contains a group header . But this time, you'll also need to insert two new sections within the Group Header. To do this, click on the Group Header section on the far right, right-click, and choosing Section Expert. Additionally, you'll need to add two subreports for the Line Chart and Pie Chart, by clicking Insert...SubReport.
Your report shows charts for two different locations, so you'll also need to establish a subreport link between the location number in the main report body and the location number in the subreport. Without subreport links, the chart within the subreport cannot identify which group key to chart. Subreport links are established by right-clicking on the subreport and choosing Change Subreport Links. The subreport links screen allows you to define the common key between the main report and a subreport.
At this point you've built the basic report/chart. By following the tip from above to load data for previewing, and right-clicking on sections of each chart to set options, you can customize the appearance of the graphs to suit your needs.
Finally, you can integrate the report into the application by adding it to the project and then calling RunReport with the DataSet and report object name. So long as the DataSet contains all of the datatables that are used in each report and subreport, RunReport will loop through each report and subreport object and set the data sources accordingly.
Tip 11: Printing Dynamic Images
I've seen a few requests on different forums to print a different image for each row or set of rows. The image might be a scanned employee photo, a bitmap of a country flag, or some other type of image.
A technique exists that has been presented both on the Business Object's Developer Zone site at www.businessobjects.com/products/dev_zone, and also in various books on Crystal Reports. In general, you want to create a data column of type Byte, store the image in the Byte column for each row to be represented, generate the XML or XSD file for Crystal Reports, and then drop the image column onto the report in the Crystal Designer.
You can load an image into the Byte column by creating a file stream and binary reader to load the image into a data column:
string cFileName = "MyPicture.JPG";

// must create a stream and a reader
FileStream fsStream = new FileStream(cFileName,
FileMode.Open);
BinaryReader brReader = new
BinaryReader(fsStream);
DataRow DrNewRow;
DrNewRow = MyTable.NewRow();
DrNewRow["myimagecolumn"] =
    brReader.ReadBytes((int)br.BaseStream.Length);
MyTable.Rows.Add(DrNewRow);
You'll probably read the images out of an array, collection, from a folder, etc. Likely, you will use some type of loop. However, you could also use a simple function that receives the name of the image as a parameter.
Tip 12: Printing Rich Text
In a recent application, I had to take rich text that a user entered and preserve any formatting (bold, underline, etc.) when I reported on the text. It turns out this is easy in Crystal Reports: any data element that could contain rich text attributes can be represented as such by right-clicking on the data element in the Crystal Designer, choosing Format Field, and selecting Text Interpretation...RTF Text on the Paragraph tab of the Format editor.
Tip 13: Deploying a Crystal Reports 10 Application
Business Objects provides documentation on deploying Crystal applications. You can find the documentation by searching for the file Deploying_Cr10_Net.PDF on Business Object's support site (support.businessobjects.com). This document covers different Crystal deployment scenarios.
Deploying a Crystal application requires you to create a setup project in Visual Studio .NET. The setup project includes one or more merge modules from Business Objects. You can also find these merge modules on Business Object's support site (support.businessobjects.com) by searching for the file CR10_NET_MERGE_MODULES.
The PDF file mentioned above covers the steps for creating the setup project. It's worth noting that a setup project cannot be built unless you provide a valid keycode. (Business Objects provides the keycode as part of the registration process when you purchase Crystal Reports).
Closing Thoughts:
You can download the complete source code and project for this article from my Web site at www.commongroundsolutions.net. Sometimes seeing tips like these can spark new ideas for other applications, so maybe you have some new ideas for using other reporting applications.
The objective of this article was to help you become productive with Crystal Reports. You'll find a wealth of technical information on this great reporting tool. As I mentioned above, Business Objects' Developer Zone (http://www.businessobjects.com/products/dev_zone/) contains a tremendous amount of information. These two books, Crystal Reports .NET Programming by Brian Bischof, and Professional Crystal Reports for Visual Studio .NET by David McAmis, are also excellent references.
I can think of a few possibilities to further develop this project that I'll leave in your hands. You may recall that each report had a common header and footer. You could take these and turn them into two subreports (as separate RPT files) that get read in to any report that uses them. You could then use those as template subreports every time you add a new report, as opposed to recreating them (or copy/pasting them) every time.
You might also want to modify the reusable Crystal Manager class to suit to your needs. Sometimes just the process of making one or two changes to an existing library can greatly increase your understanding of how it all works.
Yet another possibility might be modifying these classes to work with ASP.NET. Although the class library is geared toward Windows Forms, you can adapt several of the techniques with some modifications to work within a Web Forms environment.
I encourage you to pull down the code and test project, and to tweak it to your own needs and satisfaction. I plan to maintain and update this library on my Web site. If you have suggestions or ideas you'd like to share, I'd love to hear from you.


