One of the very many cool new features in Visual Studio 2005 is the debugger visualizer.
With debugger visualizers, developers are able to define what information they would like to see about a particular .NET class or even one of their own classes during debug mode. And as the name suggests, you can also choose how you would like to visualize these details.
The real beauty of debugger visualizers is that you can write your own. You can create debugger visualizers to display information about .NET Framework classes or your own custom classes.
Visual Studio 2005 has some pre-existing visualizers that you will discover during debug mode. You can access the visualizers by using a dropdown list on the left side of the new DataTips between the selection and its value. (Note that prior to the November Community Technical Preview (aka CTP), the dropdown was on the right. You will find the new position much more convenient.) For example, if you point to a string object in Debug mode as in Figure 1, or even an actual string as in Figure 2, you will have access to three debugger visualizers: Text, XML or HTML.


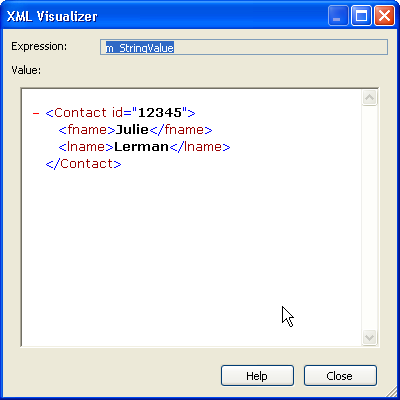
You can also access visualizers through the Watch windows. Figure 3 shows the DataTip's Watch window where you can see the _stringvalue property of a StringBuilder object. When you select the XML visualizer, you will get a better view of the XML-formatted string, demonstrated in Figure 4.

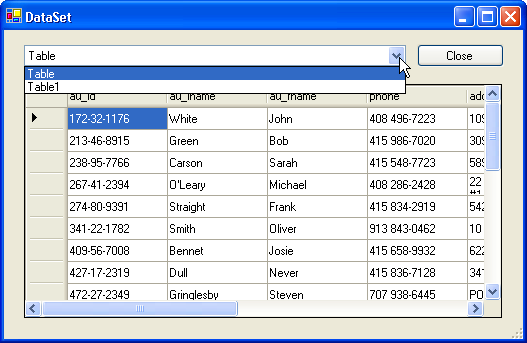
Another handy visualizer that Microsoft has already written and included with the Beta1 version of Visual Studio 2005 is for DataTables and for DataSets. Something that surely many developers have considered?this visualizer presents a quick way to see the contents of a DataTable. Though they are named “DataSet visualizer” and “DataTable visualizer,” they present the same UI. These two visualizers are read-only. The screenshots in a DataSet visualizer in Figure 5 and Figure 6 show how you can select the various DataTables within a DataSet to view.

Look for more “out-of-the-box” visualizers in future releases of Visual Studio 2005.
Roll Your Own Visualizers
The real beauty of debugger visualizers is that you can write your own. You can create debugger visualizers to display information about .NET Framework classes or your own custom classes.
Because of the possibility that you might accidentally deploy code with your debugging tool built into it, you may consider creating separate tools for invoking and debugging your visualizer debuggers.
Debugger visualizers inherit from the DialogDebuggerVisualizer class which is part of the Microsoft.VisualStudio.DebuggerVisualizers assembly. Note that Microsoft did not include this assembly with the current Express versions of Visual Studio 2005 Beta 1. Since you will need to compile and deploy your visualizers, they are not written in the same project or the same solution as the projects that will actually use them. After you write the required code to identify the visualizer and what class it will work with, you can write whatever code you wish to create the display information.
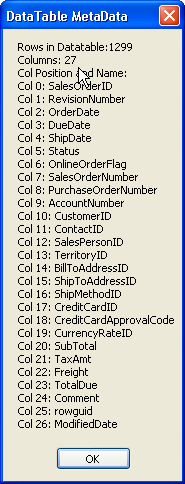
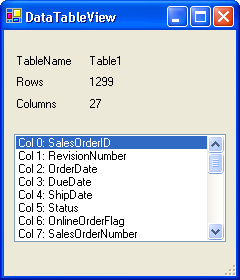
As an example, Figure 7 and Figure 8 demonstrate two custom visualizers that show some helpful metadata about a DataTable object. The visualizer in Figure 7 builds a string and displays it in a MessageBox while Figure 8 shows the result of a visualizer sending information to various controls in a Windows Form.
Building a Debugger Visualizer
A few ground rules:
- Each debugger visualizer is a separate class.
- You can combine multiple debugger visualizers for the same class into one project/assembly.
- Debugger visualizers for different classes must reside in a separate project.
- You may have multiple assemblies targeted to the same class.
Start by creating a new Class Library project and then add a project reference to the Microsoft.VisualStudio.DebubberVisualizers dll. By default this is located in C:\Program Files\Microsoft Visual Studio 8\Common7\IDE\PublicAssemblies\Microsoft.VisualStudio.DebuggerVisualizers.dll.
Create a new class in your project.
Your class must inherit from the DialogDebuggerVisualizer class and also must override the Show method from that class.
C#:
namespace CustomDV
{
  public class DTMsgBox : DialogDebuggerVisualizer
    {
    public DTMsgBox()
    {
    }
    override protected void Show
      (IDialogVisualizerService windowService,
      IVisualizerObjectProvider objectProvider)
{
      //logic and display code here
}
    }
}
VB:
Namespace CustomDV
  Public Class DTWinForm
    Inherits DialogDebuggerVisualizer
    Protected Overrides Sub Show( _
     ByVal windowService _
     As IDialogVisualizerService, _
     ByVal objectProvider _
     As IVisualizerObjectProvider)
      'logic and display code here
     End Sub
    End Class
End Namespace
Additionally, you will need to create a DebuggerVisualizer attribute for the class. This attribute has three parts.
Note that the C# syntax is quite different than Visual Basic.
C#:
[assembly:
  DebuggerVisualizer(typeof(CustomDV.DTMsgBox),
  Target = typeof(System.Data.DataTable),
  Description = "MetaData:MessageBox")]

namespace CustomDV
{
  public class DTWinForm: DialogDebuggerVisualizer
VB:
<Assembly:
DebuggerVisualizer(GetType(CustomDV.DTMsgBox), _
 Target:=GetType(System.Data.DataTable), _
 Description:="MetaData:VB MessageBox")>

Namespace CustomDV
    Public Class DTWinForm
    Inherits DialogDebuggerVisualizer
The objectProvider parameter of the Show method is the key to accessing the class that will be debugged - in this case, a DataTable. So the first step is to cast the objectProvider to a DataTable.
C#:
DataTable dt=new DataTable();
dt=(DataTable) objectProvider.GetObject();
VB:
Dim dt As DataTable = _
  CType(objectProvider.GetObject, DataTable)
Now that the basic part of the visualizer is set up, you can write code to define what to display. For this visualizer, a StringBuilder object was created with metadata from the DataTable.
Listing 1 shows the complete listing for this debugger visualizer in C#. Listing 2 shows the same class written in Visual Basic.
You are not limited to MessageBox displays for your debugger visualizers. Listing 3 gives a C# example of a class for a debugger visualizer that displays a Windows Form. Additionally, the class has a new name that is also reflected in the assembly attribute. The description in the attribute has been changed as well to differentiate it from the MessageBox visualizer. Listing 4 shows this class written in Visual Basic.
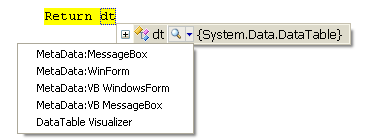
Figure 9 demonstrates these four custom visualizers now available during debug mode.
Debugging the Debugger
You can debug your custom debugger visualizer from within another project. The VisualizerDevelopmentHost class in the Microsoft.VisualStudio.DebuggerVisualizers namespace allows you to invoke the debugger visualizer programmatically without having to go through the DataTip to access it. This means you have a hook into your visualizer class and can debug into the project.
Note that an invoked debugger visualizer will run in the compiled application, just like any other class, regardless of whether it is compiled in Debug or Release mode. Therefore it is important that you consider the potential problem of accidentally deploying code with an active visualizer built in, because your end users will, indeed, see the visualizer. It may be more prudent to build a separate testing UI to debug your visualizers.
Here are the steps to debug a debugger visualizer.
- Load the project for your custom visualizer into the solution for your Windows Form application.
- Add a reference to the debugger visualizer project to the Windows Form project.
- Add a reference to Microsoft.VisualStudio.DebuggerVisualizers in the Windows Form project.
At the point in your code that the DataTable has been populated, add the following code to invoke the Debugger Visualizer class passing in the DataTable object and a type reference to visualizer.
C#:
DataTable dt =GetADataTable();
VisualizerDevelopmentHost dv=
 new VisualizerDevelopmentHost(
  dt, typeof(CustomDV.DTMsgBox));
dv.ShowVisualizer();
VB:
Dim dt as DataTable=GetADataTable()
Dim dv As VisualizerDevelopmentHost = New
VisualizerDevelopmentHost(dt,
GetType(CustomDV.DTMsgBox))
dv.ShowVisualizer()
Because of the possibility that you might accidentally deploy code with your debugging tool built into it, you may consider creating separate tools for invoking and debugging your visualizer debuggers.
Deploying a Custom Debugger Visualizer
Debugger visualizers get stored in a specific place on the developer's computer. Build your project in Release mode. Then in Windows Explorer, locate the DLL that you have created and copy it to My Documents\Visual Studio\Visualizers. Note that if you have not yet used the out-of-the-box debugger visualizers, you will have to create the Visualizers folder. Also, this location has changed over a number of releases of the Visual Studio 2005 CTPs and Beta, so watch for the chance of it moving again in future releases.
Once the assembly exists in this folder, your custom debugger visualizer becomes part of your Visual Studio 2005 debugging environment.
Naturally, you can share your custom debugger visualizers with other developers by distributing the assemblies.
Conclusion
With all that is new and exciting about Visual Studio 2005 and .NET Framework 2.0, this fantastic new feature, one of a number of great additions to Diagnostics in .NET Framework, has been sorely overlooked so far. As more and more developers realize the beauty of this class, watch the community space for custom visualizers that other developers have written.
Listing 1: This is the complete C# code for the custom debugger visualizer that is displayed in Figure 7.
#region Using directives

using System;
using System.Text;
using System.Diagnostics;
using System.Windows.Forms;
using System.Data;
using Microsoft.VisualStudio.DebuggerVisualizers;

#endregion
[assembly: DebuggerVisualizer(typeof(CustomDV.DTMsgBox),
  Target = typeof(System.Data.DataTable),
  Description = "MetaData:MessageBox")]
namespace CustomDV
{
  public class DTMsgBox : DialogDebuggerVisualizer
    {
    public DTMsgBox()
    {
    }
    override protected void Show
      (IDialogVisualizerService windowService,
      IVisualizerObjectProvider objectProvider)
{
    DataTable dt=new DataTable();
      dt = (DataTable)objectProvider.GetObject();
      String rowcount=dt.Rows.Count.ToString();
String colcount  = dt.Columns.Count.ToString();
StringBuilder sb =new StringBuilder();
int i=0;
foreach(DataColumn dc in dt.Columns)
{
sb.AppendLine("Col " + i.ToString() + ": "
                    + dc.ColumnName);
i+=1;
}
MessageBox.Show("Rows in Datatable:" + rowcount
        + System.Environment.NewLine + "Columns: "
        + colcount + System.Environment.NewLine
        + "Col Position and Name:"
        + System.Environment.NewLine + sb.ToString(),
        "DataTable MetaData");
}
}
}
Listing 2: This is the complete Visual Basic code for the custom debugger visualizer that is displayed in Figure 7.
Imports System
Imports System.Diagnostics
Imports System.Text
Imports System.Windows.Forms
Imports Microsoft.VisualStudio.DebuggerVisualizers

<Assembly: DebuggerVisualizer(GetType(CustomDV.DTMsgBox), _
  Target:=GetType(System.Data.DataTable), _
  Description:="MetaData:VB MessageBox")>

Namespace CustomDV
  Public Class DTMsgBox
      Inherits DialogDebuggerVisualizer
    Protected Overrides Sub Show( _
      ByVal windowService As IDialogVisualizerService, _
      ByVal objectProvider As IVisualizerObjectProvider)

      Dim dt As DataTable = CType( _
        objectProvider.GetObject, DataTable)
      Dim rowcount As String = dt.Rows.Count.ToString()
      Dim colcount As String = dt.Columns.Count.ToString()
      Dim sb As StringBuilder = New StringBuilder()
      Dim i As Int32 = 0
      For Each dc As DataColumn In dt.Columns
        sb.AppendLine("Col " + i.ToString() + ": " + dc.ColumnName)
        i += 1
      Next
      MessageBox.Show("Rows in Datatable:" + rowcount _
      + System.Environment.NewLine + "Columns: " + colcount _
      + System.Environment.NewLine + "Col Position and Name:" _
      + System.Environment.NewLine + sb.ToString(), _
      "DataTable MetaData")
    End Sub
  End Class
End Namespace
Listing 3: This C# code replaces the Show method, class name, and assembly attribute parameters in Listing 1 to produce the Windows Form version of the debugger visualizer displayed in Figure 8. Note the use of the new generic List<T> collection.
#region Using directives

using System;
using System.Collections.Generic;
using System.Text;
using System.Diagnostics;
using System.Windows.Forms;
using System.Data;
using Microsoft.VisualStudio.DebuggerVisualizers;

#endregion
[assembly: DebuggerVisualizer(typeof(CustomDV.DTWinForm),
  Target = typeof(System.Data.DataTable),
  Description = "MetaData:WinForm")]
namespace CustomDV
{
  public class DTWinForm: DialogDebuggerVisualizer
  {
    public DTWinForm()
    { }
    override protected void Show(
      IDialogVisualizerService windowService,
      IVisualizerObjectProvider objectProvider)
      {
    	  DataTable dt=new DataTable();
  dt=(DataTable) objectProvider.GetObject();
  String rowcount=dt.Rows.Count.ToString();
  String colcount  = dt.Columns.Count.ToString();
        DataTableView frm = new DataTableView();
        frm.Rows = rowcount;
        frm.Cols = colcount;
        frm.TableName = dt.TableName;
        List<string> colList=new List<string>();
          int i=0;
    foreach(DataColumn dc in dt.Columns)
{
        colList.Add("Col " + i.ToString() + ": "
                + dc.ColumnName);
 		  i+=1;
      }
            frm.SetGrid(colList);
            frm.ShowDialog();
        }
   }
 }
Listing 4: This Visual Basic code replaces the Show method, class name, and assembly attribute parameters in Listing 2 to produce the Windows Form version of the debugger visualizer displayed in Figure 8.
Imports System
Imports System.Diagnostics
Imports System.Text
Imports System.Windows.Forms
Imports Microsoft.VisualStudio.DebuggerVisualizers

<Assembly: DebuggerVisualizer(GetType(CustomDV.DTWinForm), _
 Target:=GetType(System.Data.DataTable), _
 Description:="MetaData:VB WindowsForm")>

Namespace CustomDV
    Public Class DTWinForm
    Inherits DialogDebuggerVisualizer
    Protected Overrides Sub Show( _
    ByVal windowService As IDialogVisualizerService, _
    ByVal objectProvider As IVisualizerObjectProvider)
      'logic and display code here
      Dim dt As DataTable = CType(objectProvider.GetObject, _        DataTable)
      Dim rowcount As String = dt.Rows.Count.ToString()
      Dim colcount As String = dt.Columns.Count.ToString()
      Dim frm As New viewmetadata
      frm.Rows = rowcount
      frm.Cols = colcount
      frm.TableName = dt.TableName
      Dim colList As New Collections.Generic.List(Of String)
      Dim i As Int32 = 0
      For Each dc As DataColumn In dt.Columns
        colList.Add("Col " + i.ToString() + ": " + dc.ColumnName)
        i += 1
      Next
      frm.SetGrid(colList)
      frm.ShowDialog()
    End Sub
  End Class
End Namespace


