To improve your developing productivity, Microsoft made Visual Studio 2022 more intelligent, more approachable, and lighter weight. For the first time ever, Visual Studio is 64-bit. With enhanced speed, combined with AI coding assistance, ever expanding productivity tools, and streamlining team collaboration, this new version of Visual Studio has you set up for success. In this article, I'll cover my favorite productivity enhancements in Visual Studio 2022 that will make your workflow more efficient.
Performance
Improving performance is always a top customer request. In Visual Studio 2022, Microsoft made significant progress, including making Visual Studio 64-bit and reducing the time it takes for several operations. Here are some of the immediate benefits:
- Faster search
- Faster incremental build
- Faster test execution
- Faster frameworks
Now that it's a 64-bit application, the devenv.exe process is no longer limited to ~4 GB of memory. For users with large or complex solutions, this is a game changer. You'll have more memory and avoid out of memory exceptions for every aspect of daily development: opening, editing, searching, running, and debugging. This move to 64-bit doesn't change the types or bitness of the applications you develop with Visual Studio. You can still build 32-bit apps with 64-bit Visual Studio with all the performance benefits of working with more memory available.
Faster Search
A performant search is key to a fast and productive developer inner loop. In Visual Studio 2022, searching for file names is faster. You'll see improvements, especially after the initial solution load, because Visual Studio can preserve more context in between opening and closing a solution. Go To (Ctrl + T), Visual Studio Search (Ctrl + Q), and Find in Files (Ctrl + Shift + F) have improved significantly. Additionally, Solution Explorer search is now 50% faster when tested on popular open-source repositories such as Orchard Core.
Faster Incremental Build
Incremental build allows you to avoid the extra overhead of re-building components that are still up to date despite all recent changes. This saves a massive amount of time and resources, so it's important that this system is as accurate and performant as possible. Microsoft improved the “Fast up to date” check to better detect file changes for .NET and .NET Core projects. This performance improvement speeds up any feature that depends on build execution like debugging and unit testing.
Faster Test Execution
With the introduction of Hot Reload, Microsoft has reduced the time it takes to execute tests in C# projects targeting .NET 6.0 or later. Additionally, by further optimizing Live Unit Testing start up processes, the time to start up Live Unit Testing is reduced. A 30% improvement was observed when tested on popular open-source repositories, such as Orchard Core.
Faster Frameworks
I would be remiss to cover Visual Studio performance without mentioning the amazing gains seen at the platform level with each new framework version. particularly regarding .NET 5.0 and .NET 6.0. Any app or developer tool using the latest major frameworks is going to instantly see performance gains in even the most fundamental operations. There's a multiplicative effect with any performance optimizations in the JIT (just-in-time compiler), the garbage collector, threading, types in the System namespace, etc. Visual Studio is one of the developer tools that gets to reap the rewards as features update to target the latest versions.
If you want an in-depth look at the .NET performance improvements (including benchmarks down to the nanosecond!), check out https://aka.ms/dotnetperf6.
Personal and Team Productivity
One of the first things developers do in Visual Studio is personalize it. Making your environment comfortable to work in is an essential part of getting into the zone. Both customizing your IDE and syncing your personal settings across devices have some new capabilities:
- Organize your workspace using color
- Match the Visual Studio theme to the Windows theme
- Improved theming flexibility
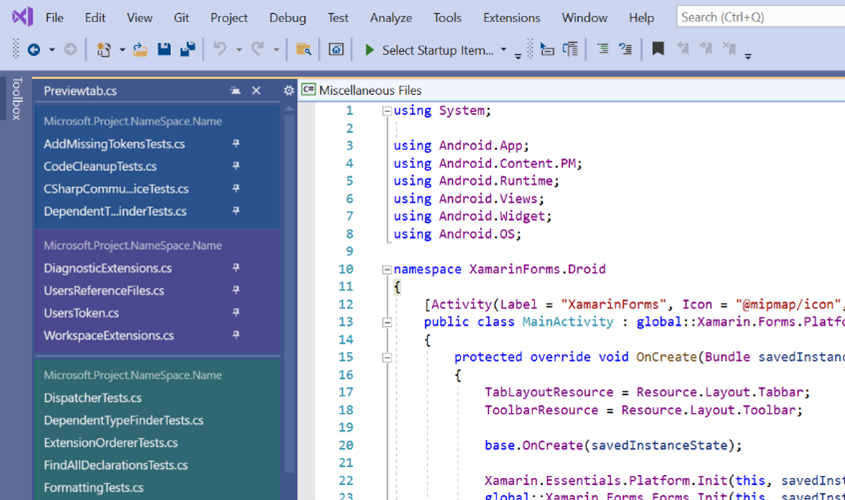
Visual Studio now has the capability to organize tabs by color, so you don't have to search for an open file. Your active document can be bolded so it's easier to find. You can also customize your tab width and appearance to suit your workflow. To find the new document management settings, navigate to Tools > Options > Tabs & Windows, as shown in Figure 1.
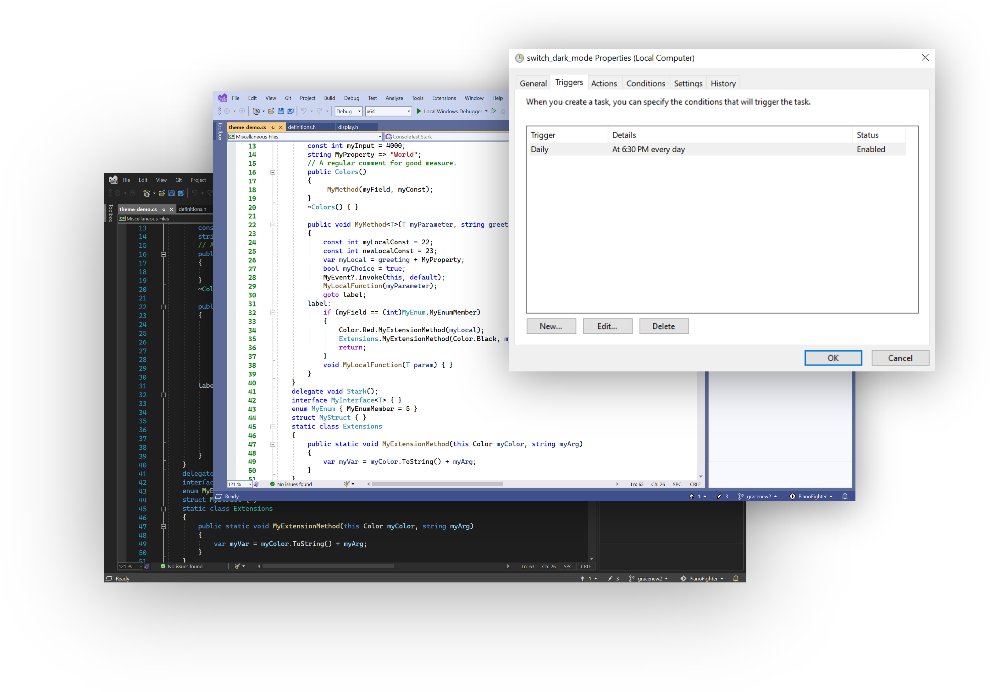
When there's little background light, shifting your theme to Night mode could improve reading. You now have the capability to match your Visual Studio theme to your Windows theme. For example, if you have a Dark theme enabled for Windows, you'll see a default Dark theme for Visual Studio 2022. You can enable this in Tools > Options > Environment > General and from the Color Theme drop-down, select Use system setting, as shown in Figure 2.
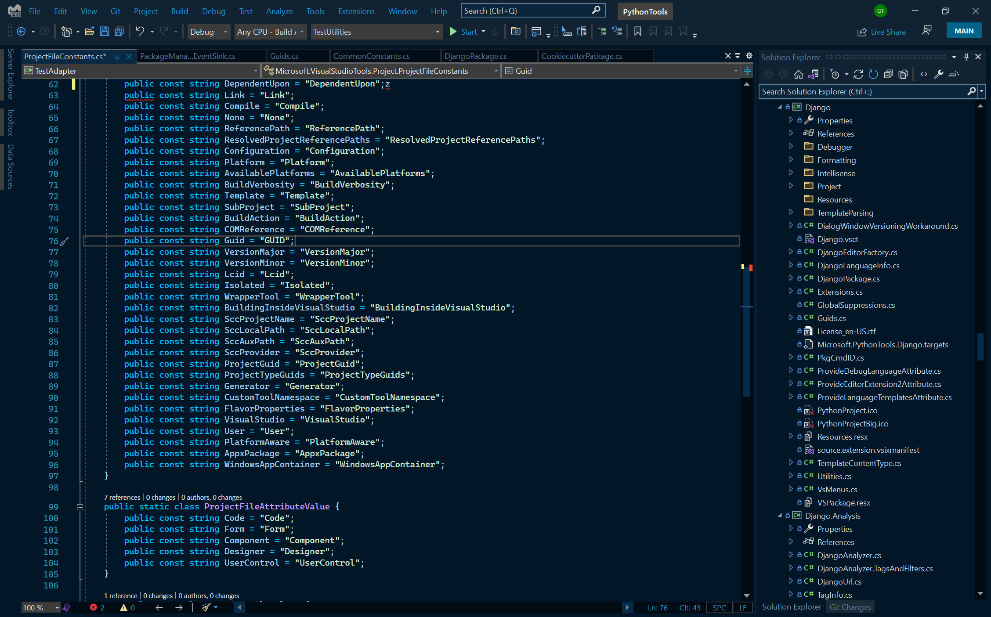
The journey is to expand the theming capabilities and make Visual Studio more inclusive. Microsoft has teamed up with the community of theme authors to convert a selection of Visual Studio Code themes to work in Visual Studio. To install a custom theme, visit the Visual Studio Marketplace, as shown in Figure 3.
Hot Reload
For many developers, one of the most time-consuming operations during the development and debugging phase is rebuilding and restarting the app in order to test a code change or complete a behavior that isn't yet implemented. The new Hot Reload experience in Visual Studio 2022 reduces the number of restarts required by allowing you to modify your .NET application's source code while it's running. Unlike the existing Edit and Continue experience, with Hot Reload, you don't need to hit a breakpoint or pause your application to apply changes.
To use Hot Reload, simply make a supported change and use the new “Hot Reload” button to apply the changes to your running app. The next time the code is executed, the updated logic will be used, reducing the need for many restart cycles.
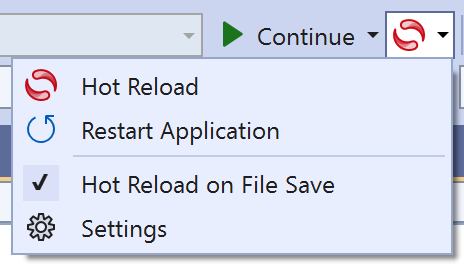
An option was also added for developers who prefer to use the Save operation to apply Hot Reload changes without the need to explicitly click the Hot Reload button. You can do so by expanding the Hot Reload menu and opting into this behavior by selecting “Hot Reload on File Save,” as shown in Figure 4.
Hot Reload is available for developers who build apps powered by both .NET Framework and .NET Core for many types of apps, such as WPF, WinUI 3, Windows Forms, ASP.NET Core (for code-behind code changes), Console Apps, and even project types such as Azure Functions. Anywhere a modern supported version of .NET is available, Hot Reload is provided while under the debugger.
In addition, those developers who upgrade to .NET 6 get additional benefits, including powerful new features only available to the latest version of .NET, such as:
- Support for using Hot Reload when not using the debugger, such as launching your app in Visual Studio through the
CTRL-F5mechanism or using the .NET CLI dotnet watch tool - Support for using Hot Reload with Razor files in both ASP.NET Core and Blazor projects
- Support for using Hot Reload with .NET MAUI apps across WinUI, iOS, and Android runtimes for both regular XAML-only projects and hybrid Blazor apps.
Hot Reload also works alongside other debugger experiences. This includes Edit and Continue for editing code during a breakpoint, as well as features that focus on the look and feel of an app while also changing code, such as XAML Hot Reload and CSS Hot Reload.
Finally, please be aware that some edits are not supported and when this situation is encountered, a “rude edit” dialog is displayed. Restarting the app at this point will be needed to apply your changes so you can move forward. This is just the start of the journey and in future releases of Visual Studio and .NET, Microsoft will be working to reduce the type of edits that aren't supported.
The New Razor Editor
In Visual Studio 2022, a new Razor editor was added for local development with MVC, Razor Pages, and Blazor. The new Razor editor has a ton of new tooling support surpassing the functionality of the old Razor editor. For instance, there's now a ton of C# code fixes and refactorings, improved syntax coloring, Go to Definition support, and item filtering in the IntelliSense completion list.
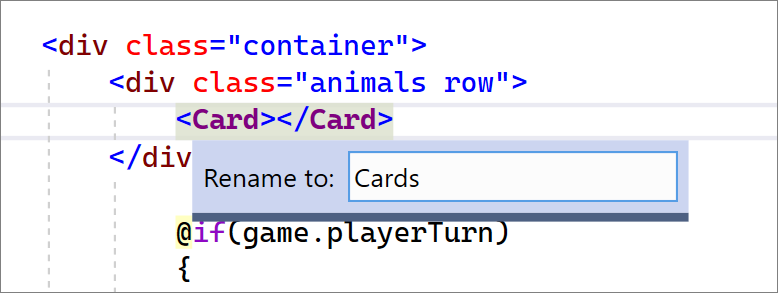
The design of the new Razor editor makes it much easier to enable C# code fixes and refactorings, and many more will be enabled in future releases. Here are just a few of my favorite code fixes and refactorings available in Razor files.
- Add missing
Usingdirectives, as shown in Figure 5. - Renaming support, as shown in Figure 6.
- Razor syntax highlighting
- Improved colorization options

Razor syntax highlighting has also been updated to improve contrast, general look and feel, and usability. For example, you may notice that the C# background highlighting has been removed. This update improves contrast and makes it clearer when something has been selected or highlighted. The colorization options in Tools > Options > Fonts and Colors has been updated to be more descriptive and customizable.
Navigation and Code Exploration
Navigating and exploring code is an integral part of developer productivity. In Visual Studio 2022, Value Tracking has been added, allowing you to perform data flow analysis on your code to help you quickly determine how certain values might have passed at a given point. Value Tracking is available on any member in the context (right-click) menu by selecting the Track Value Source command. The Track Value Source command opens the Value Tracking window allowing you to analyze results, as shown in Figure 7.

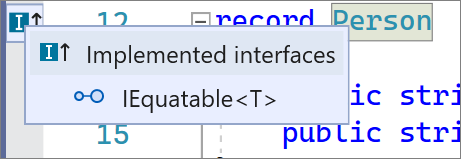
It's also easier for you to visually inspect and navigate the inheritance chain with the new Inheritance Margin icons, as shown in Figure 8. The Inheritance Margin icons are located in the margins representing your code's implementations and overrides. Clicking on the Inheritance Margin icon displays inheritance options that you can select to navigate to. If you find Inheritance Margin distracting, you can disable them in Tools > Options > Text Editor > [C# or Basic] > Advanced and deselect Show inheritance margin.
A highly anticipated feature is inline hints. Inline hints display inline parameter name hints for literals, casted literals, and object instantiations prior to each argument in function calls, and inline type hints for variables with inferred types, lambda parameter types, and implicit object creation. To enable and customize inline hints go to Tools > Options > Text Editor > [C# or Basic] > Advanced and select Inline Hints. The inline hints then appear in C# or Visual Basic files, as shown in Figure 9.

Code Fixes and Refactorings
Visual Studio provides hints to help you maintain and modify your code in the form of code fixes and refactorings. These appear as lightbulbs and screwdrivers next to your code or in the margin. The hints can resolve warnings and errors as well as provide suggestions. You can open these suggestions by typing (Ctrl + .) or by clicking on the lightbulb or screwdriver icons.
You can check out the most popular refactorings that are built into Visual Studio at https://aka.ms/refactor. A bunch of new code fixes and refactorings have been added to Visual Studio 2022. Here are some of my favorites:
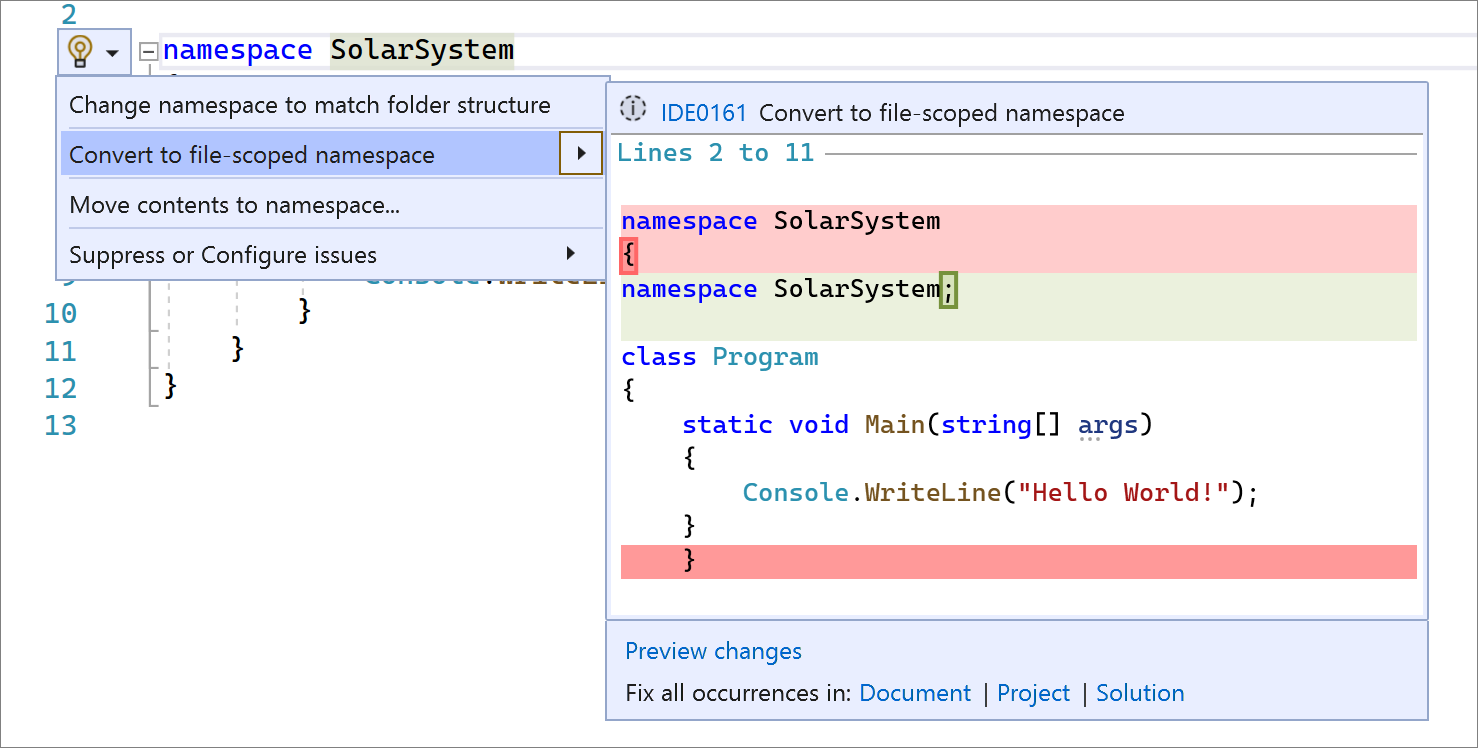
- Convert namespace to the new C# 10.0 file-scoped namespace, as shown in Figure 10.
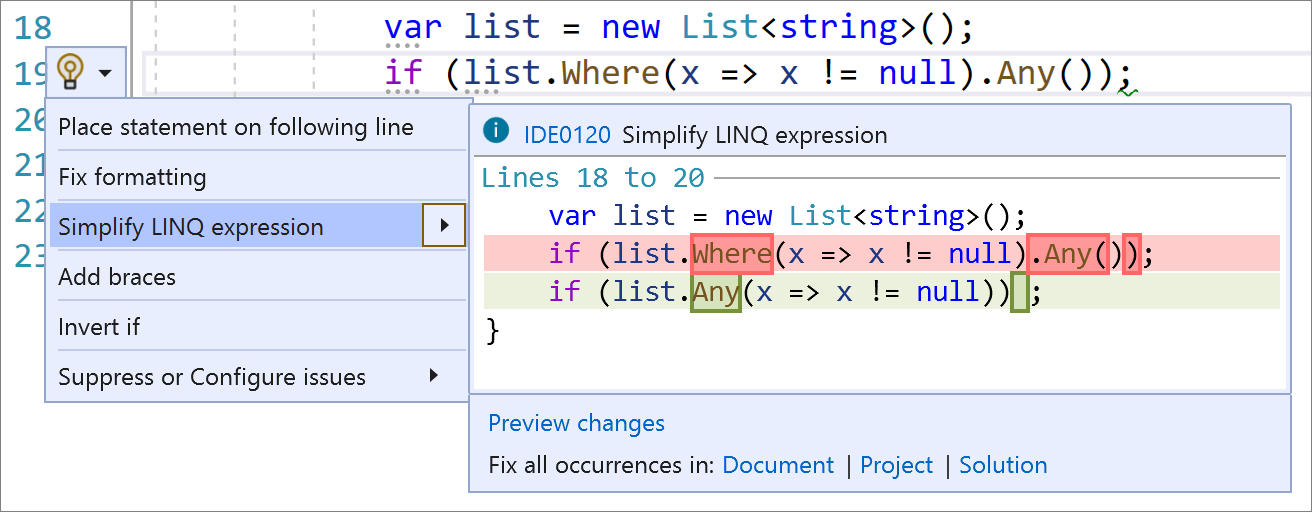
- For improved performance and readability, simplify LINQ expressions to remove the unnecessary call to the
Enumerablefor the.Where()method, as shown in Figure 11. - Extract base class
- Add explicit cast
- Extract local function
- Inline method
- Convert between verbatim string and regular string
- Generate comparison operators
- Use pattern matching
- Simplify conditional expression
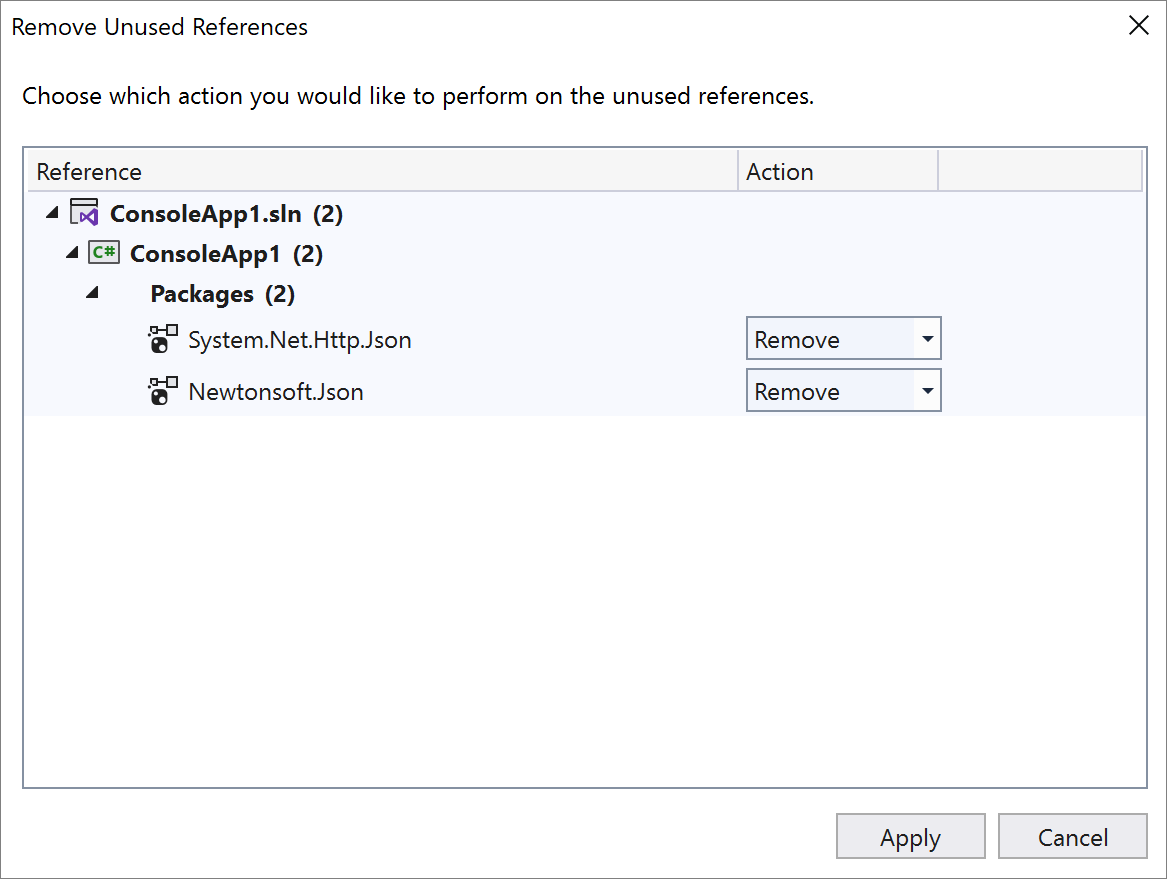
You can also invoke code fixes and refactorings from the Solution Explorer (right-click) menu. One of our highly anticipated refactorings is Remove Unused References, which allows you to clean up project references and NuGet packages that have no usage. The Remove Unused References command is available in the (right-click) menu of a project name or dependencies node in Solution Explorer, as shown in Figure 12. Selecting Remove Unused References opens a dialog where you can view all references that will be removed, with an option to preserve the ones that you want to keep.
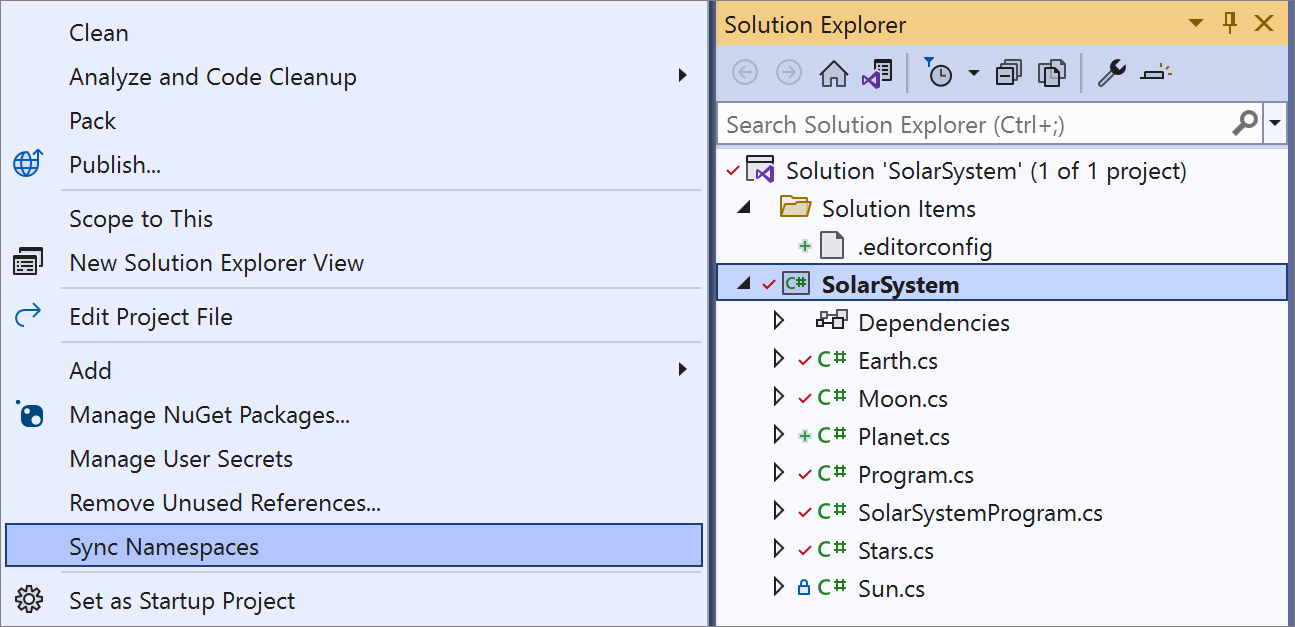
Another refactoring available in the Solution Explorer (right-click) menu is Sync Namespaces. Sync Namespaces allows you to synchronize namespaces with your folder structure. The Sync Namespaces command is available in the (right-click) menu of a project or folder in Solution Explorer, as shown in Figure 13. Selecting Sync Namespaces automatically synchronizes namespaces to match your folder structure.
.NET Analyzers
Code fixes and refactorings are powered by analyzers. An analyzer is a tool that inspects your code and reports diagnostics and errors. The .NET Compiler Platform (Roslyn) has several recommended analyzers that give you verbose feedback on code quality and code style. Starting in .NET 5.0, these analyzers are included with the .NET SDK and are enabled, by default, for projects that target .NET 5.0 or later. If you'd like to learn more about .NET analyzers, visit https://aka.ms/dotnetanalyzers.
If you want a specific analyzer that you don't see included in the .NET SDK, you can create your own analyzer with the open source Roslyn APIs. Creating your own analyzer allows you to create a diagnostic and code fix for a scenario that's special to your code base. You can then share it with your team or anyone who depends on your library. For an example tutorial, visit https://aka.ms/diy-analyzer.
Code Style Enforcement
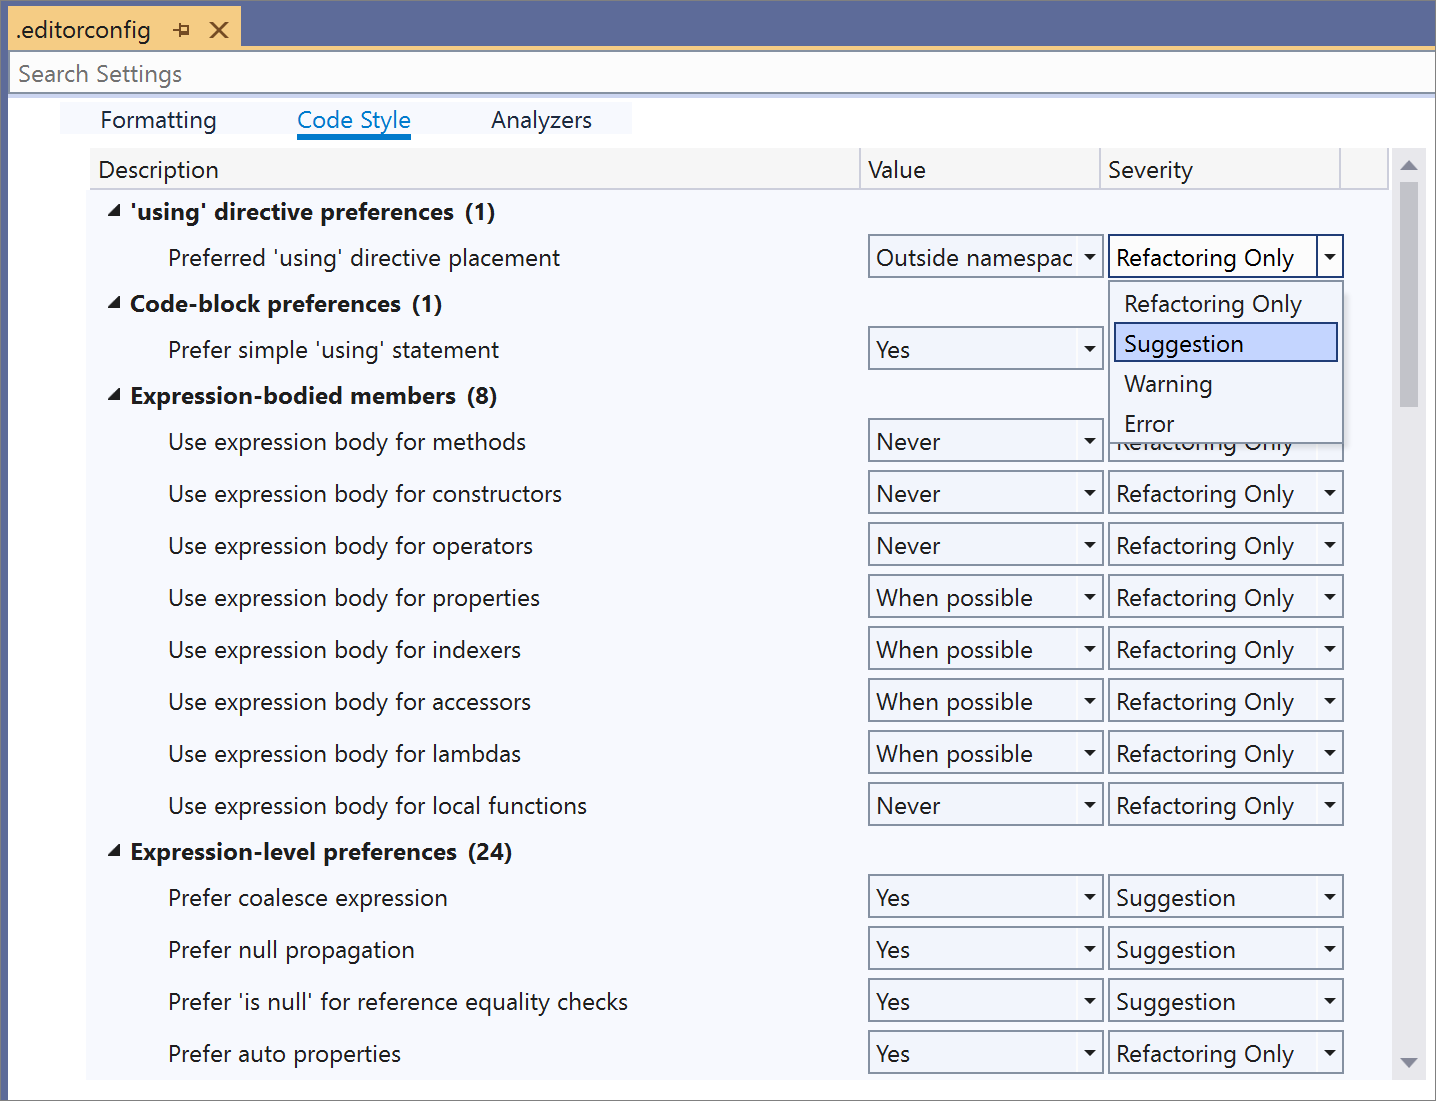
Enforcing consistent code style is important as developer teams and their code bases grow. Visual Studio allows you to configure analyzers to apply your preferred code style rules and customize the severity at which they appear in the editor, as shown in Figure 14. You can easily change your code style severity to display the rule violation as a suggestion, warning, or error in the editor.

You can configure code styles in the code style pages in Tools > Options or with EditorConfig. EditorConfig files help to keep your code consistent by defining code styles and formats. These files can live with your code in its repository and use the same source control. This way, the style guidance is the same for everyone on your team who clones from that repository. With the EditorConfig rules and syntax, you can enable or disable individual .NET coding conventions and configure the severity to which you want each rule enforced.
The style guidance is the same for everyone on your team who clones from a single repository using EditorConfig.
To add an EditorConfig file to a project or solution, right-click on the project or solution name within the Solution Explorer. Select Add New Item. In the Add New Item dialog, search for EditorConfig. Select the .NET EditorConfig template to add an EditorConfig file prepopulated with default options. An .editorconfig file appears in Solution Explorer, and it opens in the editor, as shown in Figure 15.
You can also add an EditorConfig file based on the code style settings you've chosen in the Visual Studio Options dialog. The options dialog is available at Tools > Options > Text Editor > [C# or Basic] > Code Style > General. Click Generate .editorconfig file from settings to automatically generate a coding style .editorconfig file based on the settings on this Options page.
If violations are found, they're reported in the code editor (as a squiggle under the offending code) and in the Error List window, as shown in Figure 16.

The .NET 6.0 SDK has a new command called dotnet format that you can run in the command line in order to apply code styles from an EditorConfig file or from the Code Style options page. To use dotnet format, make sure your project targets the .NET 6.0 SDK or later. Next, open the Visual Studio integrated terminal by pressing Ctrl + ' (that's an apostrophe). You can then run dotnet format to apply code style preferences across your entire solution, as shown in Figure 17. If you'd like to learn more about dotnet format, visit https://aka.ms/dotnet-format.

IntelliSense Completion
IntelliSense is a code-completion aid that includes a number of features, including List Members, Parameter Info, Quick Info, and Complete Word. These features help you to learn more about the code you're using, keep track of the parameters you're typing, and add calls to properties and methods with only a few keystrokes.
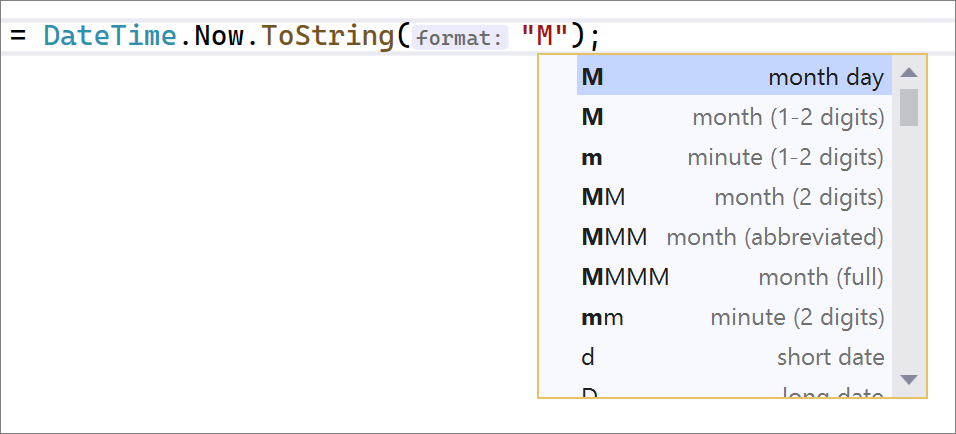
IntelliSense completion was recently added in DateTime and TimeSpan string literals for both C# and Visual Basic, as shown in Figure 18. Place your cursor inside the DateTime or TimeSpan string literal and press Ctrl + Space to open the completion list. You will then see completion options and an explanation as to what each character means.
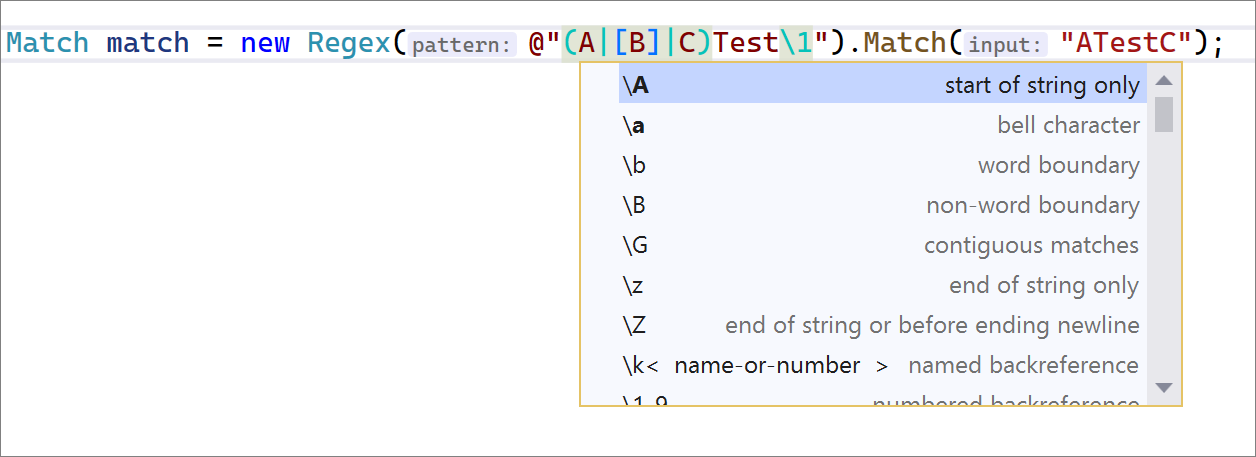
Similarly, there's IntelliSense completion for regex strings, as shown in Figure 19. These completions also include an in-line description of what the suggestion does.
IntelliCode Context-Aware Completion
IntelliCode provides AI-assisted IntelliSense in having suggestions appear at the top of the completion list with a star icon next to them, as shown in Figure 20.
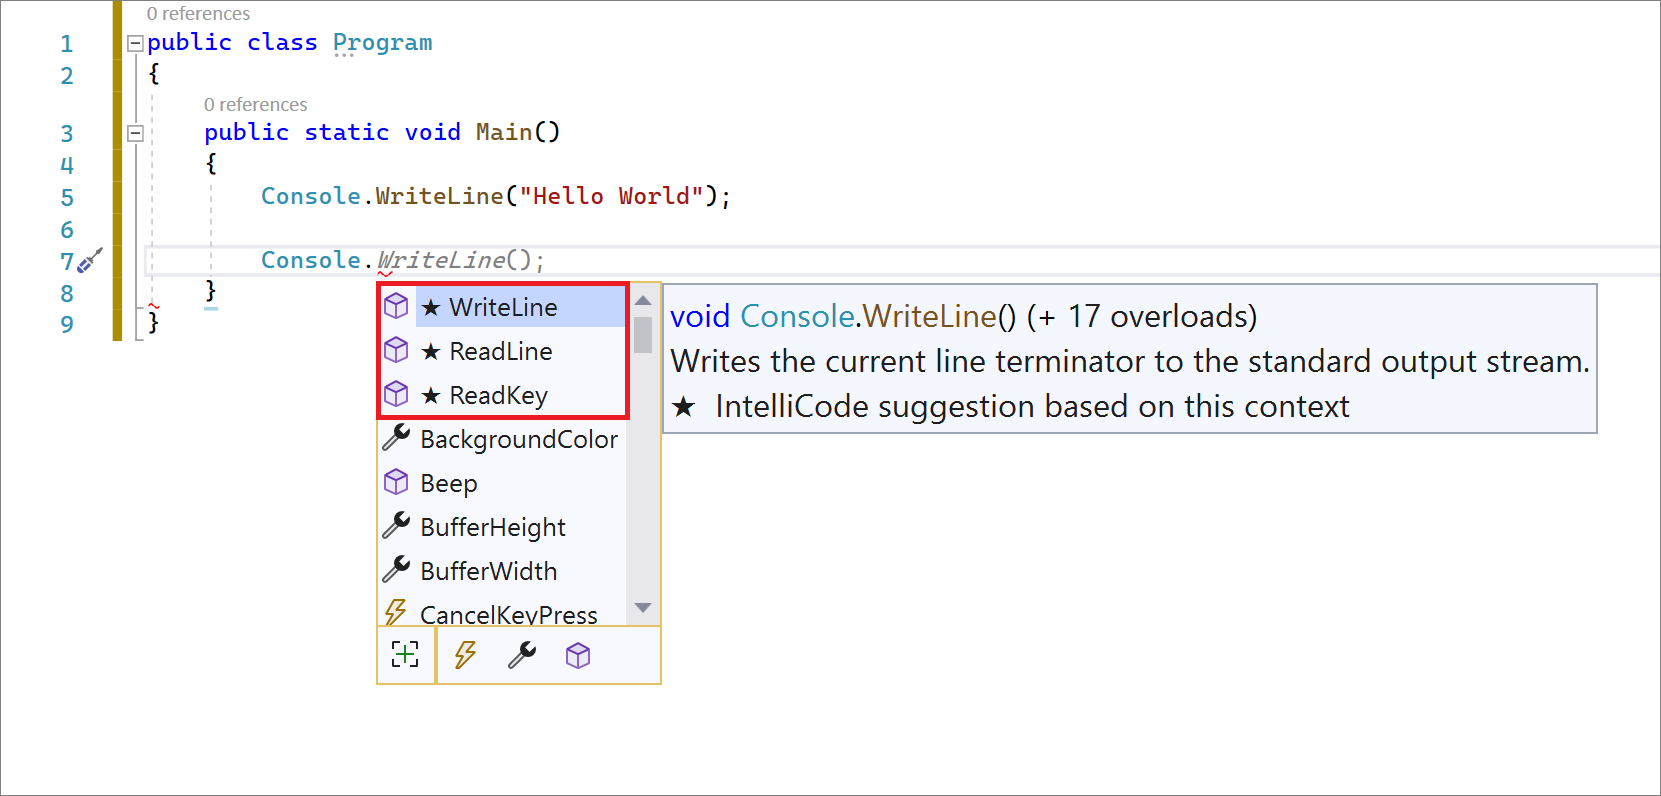
The completion list suggests the most likely correct API for a developer to use rather than presenting a simple alphabetical list of members and arguments. IntelliCode uses the developer's current code context as well as patterns based on thousands of highly rated, open-source C# projects on GitHub. The results form a model that predicts the most likely and most relevant API calls.
In addition to providing AI-assisted IntelliSense completion, IntelliCode also provides context-aware inline completion. Inline completion predicts the next line of code and presents it as an inline suggestion to the right of your cursor, as shown in Figure 21. You can either accept the completion by pressing tab-tab; or keep typing to adjust the completion further.

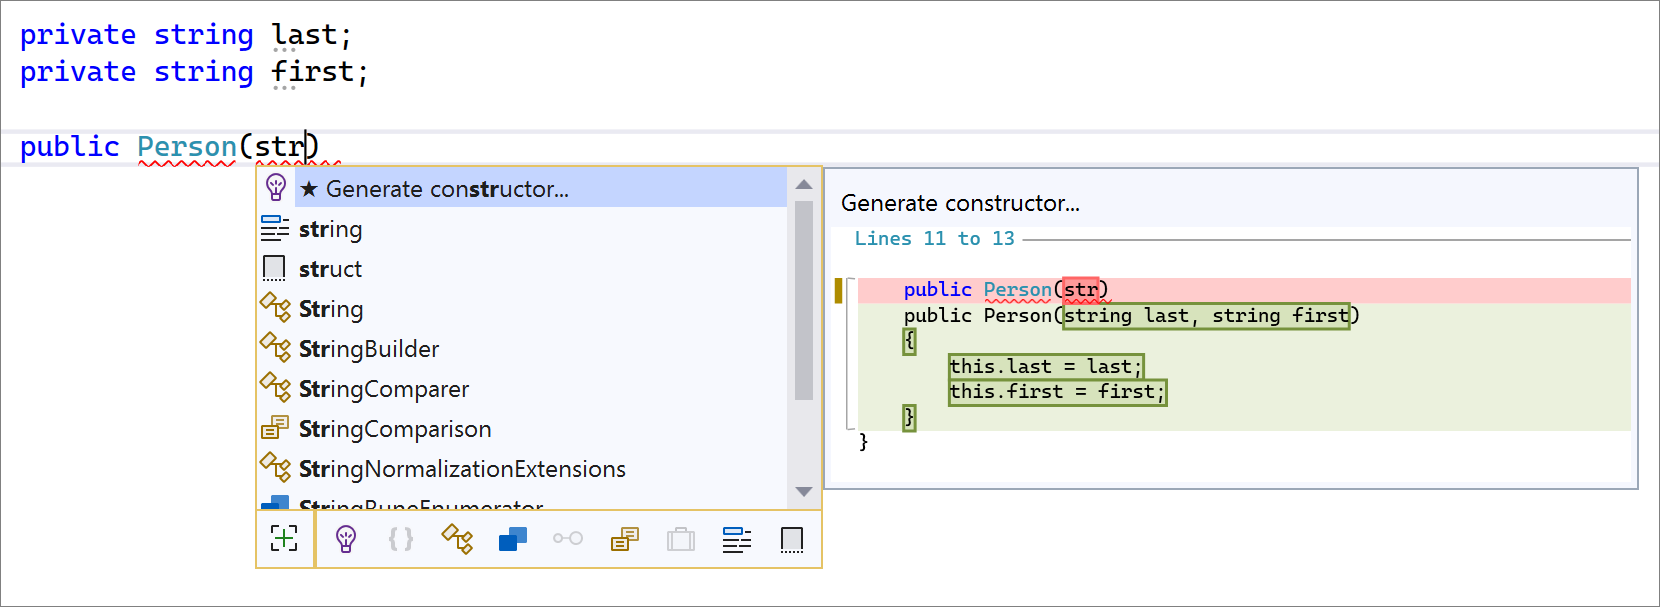
IntelliCode can detect the manual code change that you're making and suggest an action to apply to your workflow (Figure 22). This is currently supported for two scenarios: generating a constructor and adding a new parameter to a constructor.
IntelliCode can also suggest edits to assist you while you're making similar changes in multiple places in your code. It tracks edits locally and detects repetition. It then offers to apply those same edits in other places where they might apply, as shown in Figure 23. For example, if a user has missed locations where a refactoring could be applied, IntelliCode suggestions help find those locations and fixes them.

Debugging
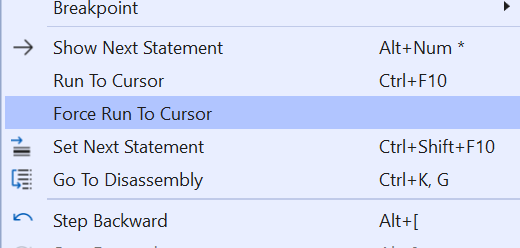
Visual Studio 2022 has added and improved upon features that enhance your productivity while debugging. The Force Run to cursor command on the right-click context menu (shown in Figure 24) lets you run directly to your cursor location in the source code by ignoring any breakpoints and any first-chance exception break conditions that may occur. Any breakpoints and first-chance exceptions encountered during execution are temporarily disabled.
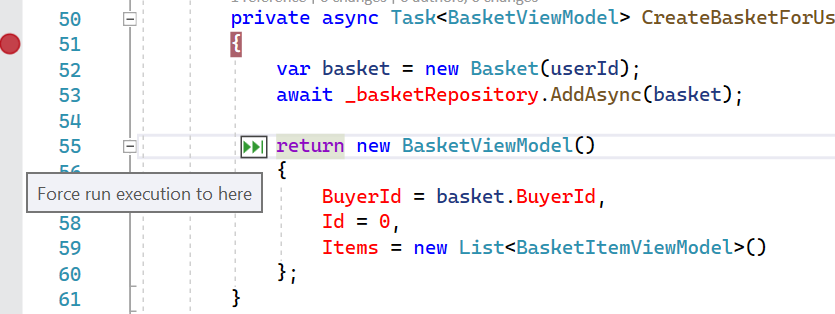
When you're in an active debug session, a green glyph with the tooltip Force run execution to here appears next to the line of code where your mouse hovers (as shown in Figure 25), along with holding a Shift key.
The breakpoint experience has also been improved with new UI gestures and functionalities to streamline the breakpoint debugging. The new temporary breakpoint lets you break the code only once. When debugging, Visual Studio debugger only pauses the application once for this breakpoint and deletes it automatically after it's been hit (as shown in Figure 26).
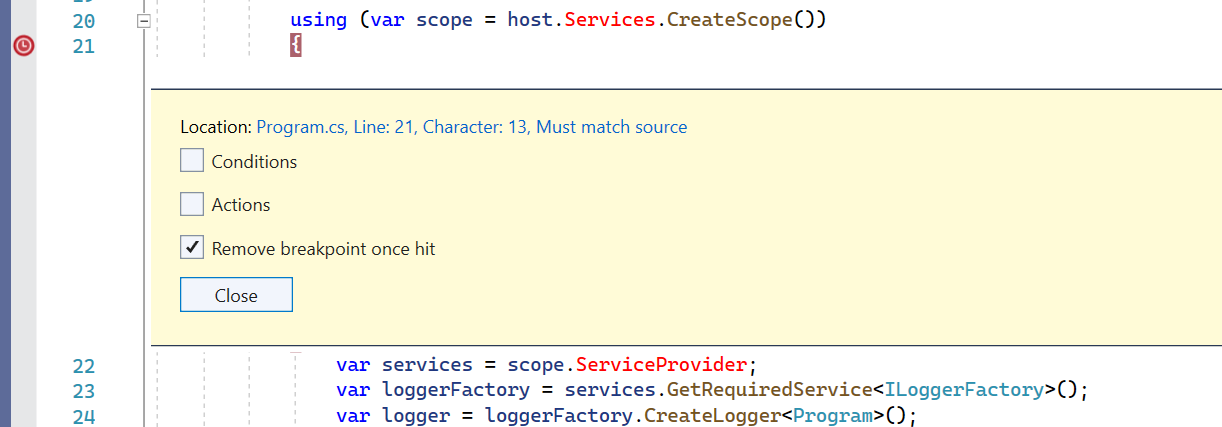
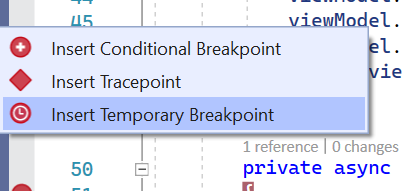
You can convert any breakpoint to a temporary breakpoint by enabling the “Remove breakpoint once hit” checkbox from the settings window or setting a new temporary breakpoint (as shown in Figure 27) with an advance breakpoint context menu on the right-click in the breakpoint gutter.
You can now also drag breakpoints from one location to another. This works for the advanced breakpoint as long as the actions/condition variables are within the Context.
There are plenty of new improvements to the Attach to Process dialog, shown in Figure 28, so you can identify the process that you want to attach much easier. With the new Command Line column and the app pool details in the Title column, you don't have to go back and forth with Task Manager to get the PID for those identical-looking processes. The Show as parent/child processes checkbox will give you a hierarchical parent-child process list view in attach to the process dialog itself.
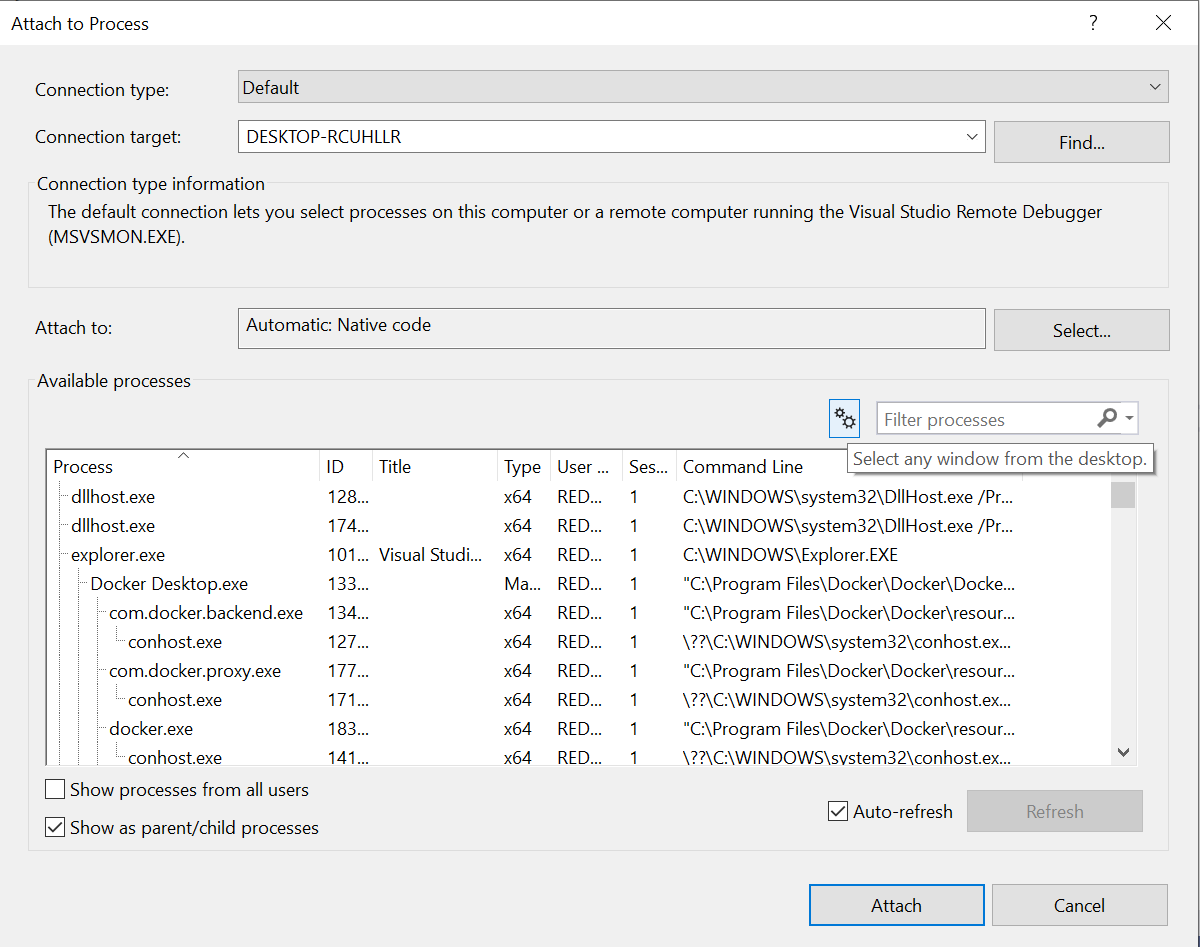
The Select any window from desktop option lets you pick any running window from the desktop and attaches it to its associated process for debugging.
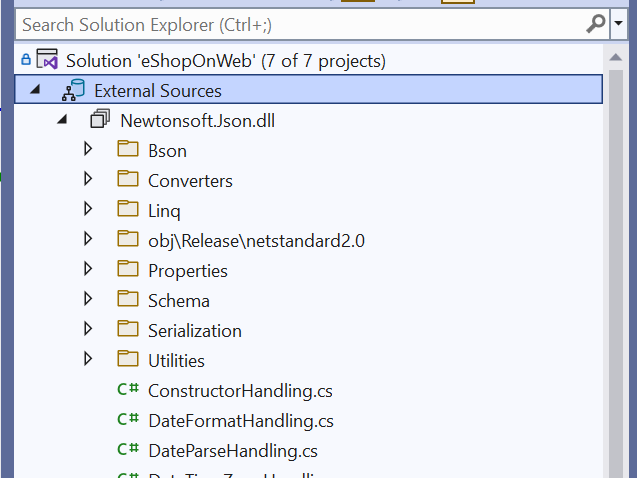
If you're working with applications that have multiple external libraries, and which have their components published to Source Servers, e.g., Newtonsoft.Json, CsvHelper, xUnit.net, etc., the new External Sources node in Solution Explorer (Figure 29) will give you an easier way to browse those sources and debug through them if needed. This node appears while debugging in the Solution Explorer and shows sources for managed modules with symbols loaded containing Source Link or Source Server information.
Remote Testing in Visual Studio
Run and debug tests on remote environments such as Linux containers, WSL, and over SSH connections from the comfort of Visual Studio. This idea of “remote testing” is now supported from the Visual Studio Test Explorer. Being able to target and debug Linux environments is crucial for cross-platform scenarios. Now you don't have to wait for feedback from CI to know how your code behaves on Linux or any other target OS. You can connect the Test Explorer directly to a remote environment, run tests there, view feedback in the Test Explorer, and even debug issues on the remote computer as they arise. Now, even testing on different operating systems can be a part of your developer inner loop!
You don't have to wait for feedback from CI to know how your code behaves on Linux or any other target OS.
For now, the feature is “bring your own compute.” This means that you entirely leave the provisioning of the remote environments up to the user. This includes installing the necessary dependencies that your tests require in your target environment. For instance, if you want your tests targeting .NET 6.0 to run in a Linux container, you need to make sure that the container has .NET 6.0 installed via your DockerFile. Someday Microsoft might create an install experience that enables smooth acquisition of any of your test dependencies, but for now, the bulk of the provisioning of the environment is up to the user's specification. To understand the full setup details, visit the remote testing documentation at https://aka.ms/remotetesting.
Remote environments are specified using testenvironments.json in the root of your solution. An example testenvironment.json for a locally running Linux container would look something like this Figure 30.
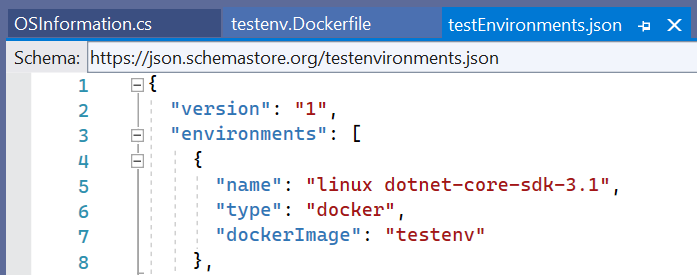
See the remote testing docs for full descriptions of the testenvironment.json schema and examples for containers, WSL, and SSH connections https://aka.ms/remotetesting.
Once the testenvironment.json is present, the Test Explorer loads a drop-down of remote environments, as shown in Figure 31.
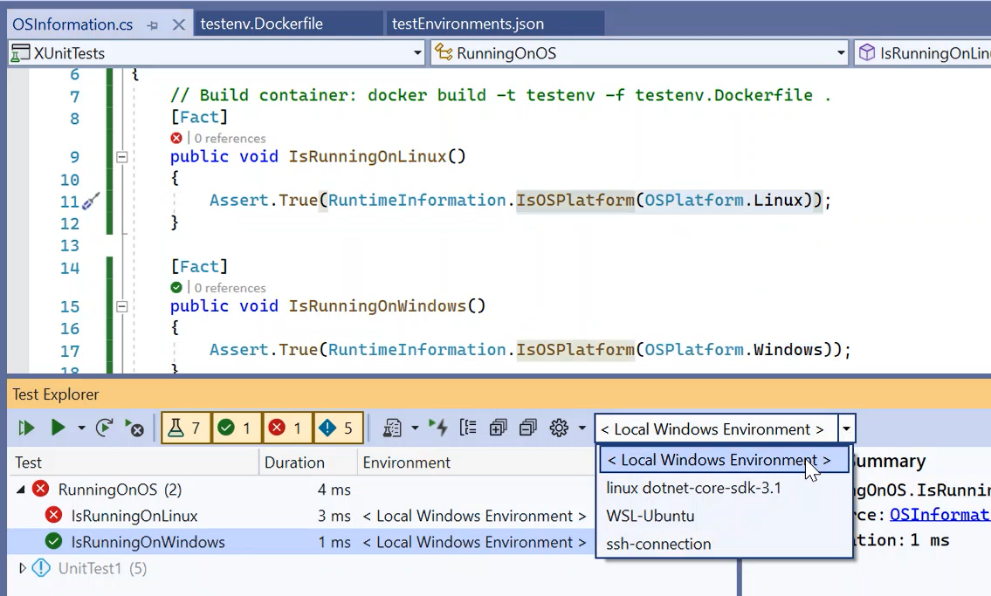
When you select a remote environment, the Test Explorer begins discovering tests in the new environment. Once the tests are loaded, you can use the Test Explorer as you normally would for running, viewing output, grouping tests, and debugging your tests all with test results data streamed from the remote connection.
Let Visual Studio bring modern, cross-platform development to your inner loop with remote testing.
GitHub and Azure DevOps
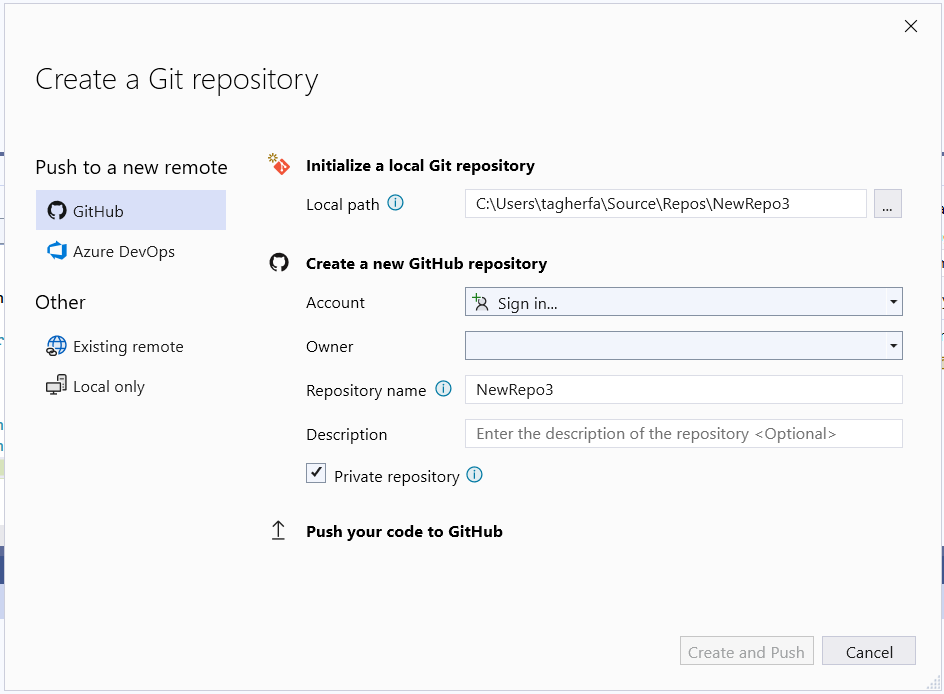
In Visual Studio 2022, Microsoft made remote development easier than ever with better GitHub integration. The Git tooling in Visual Studio 2022 makes it easy to track changes you make to your code over time so you can both track your progress and revert to specific versions. Whether you're working alone or working with a team of developers, the Git tooling in Visual Studio 2022 can be very useful to you and your team. GitHub offers free and secured cloud code storage where you can store your code and access it from any device, anywhere. Visual Studio 2022 comes with first-class GitHub and Azure DevOps functionality that makes it easy to use source control to manage your code and collaborate with others. Get started by adding your code to GitHub or Azure DevOps with the Create a Git repository dialog box, as shown in Figure 33. To do so, choose Git > Create a Git repository from the menu bar.
Streamlined and Intuitive Git Experience
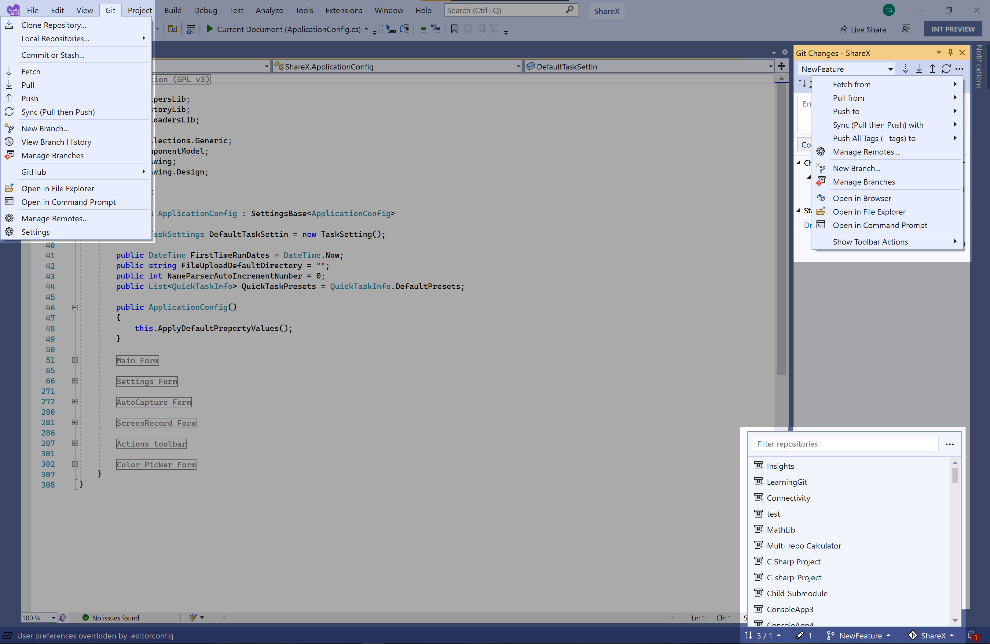
Visual Studio provides discoverable and intuitive Git features focused on maximizing the productivity of your daily workflow. You no longer need to move away from your code to commit your changes. These features include a top-level Git menu, a Git Changes window, and a Git focused Status bar. Git integrates with Visual Studio as a holistic experience; for example, both Solution Explorer and the Code Editor have a first-class Git integration, as you can see in Figure 34.
Repository Management and Collaboration
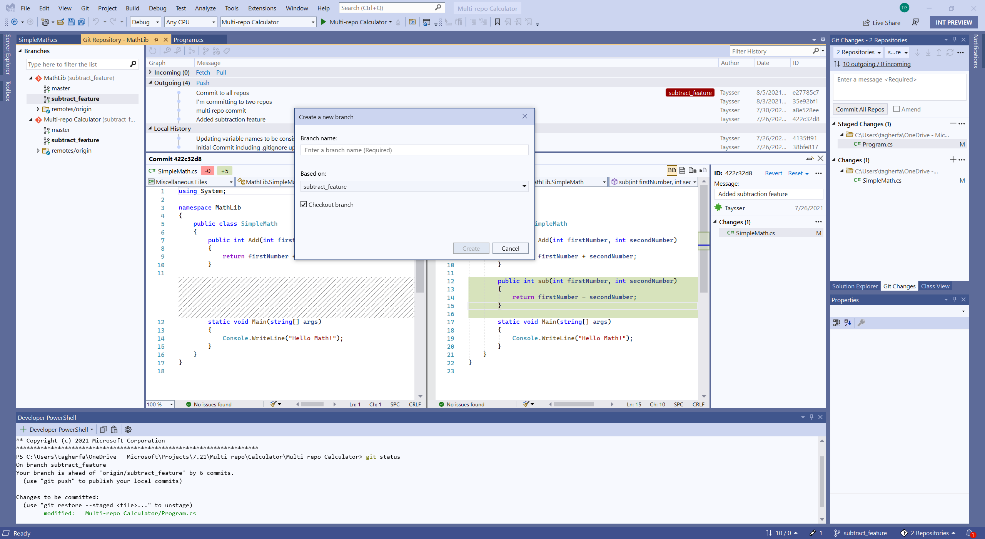
Visual Studio 2022 includes powerful multi-repository browsing and collaboration features that eliminate the need to use other tools. Stay up to date with your repository by keeping an eye on your incoming/outgoing commits, previewing branches, and comparing commits (as shown in Figure 35).

And manage your repository by managing your branches (Figure 36) and squashing and cherry-picking commits.
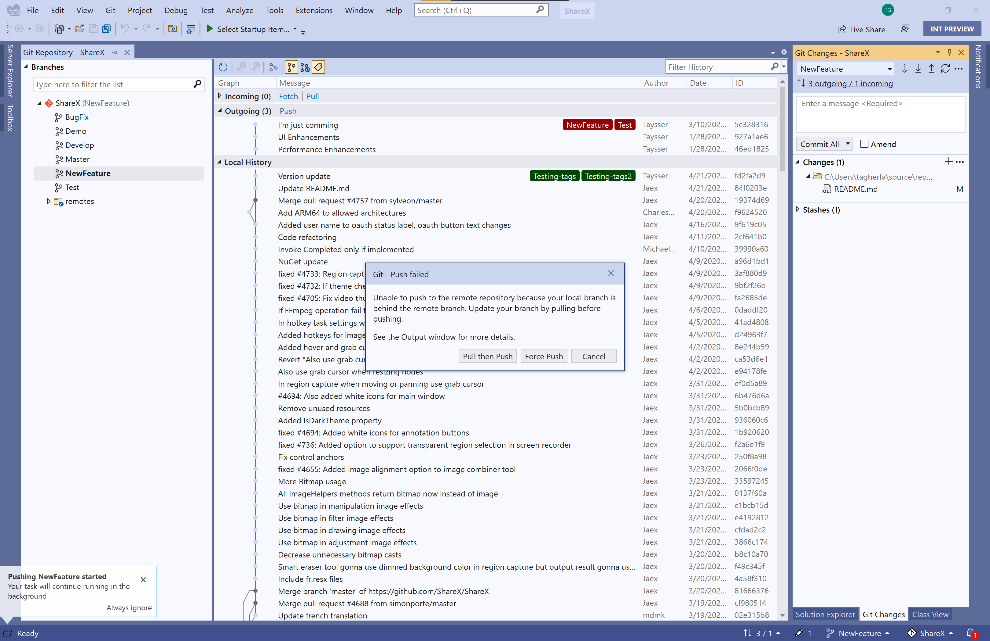
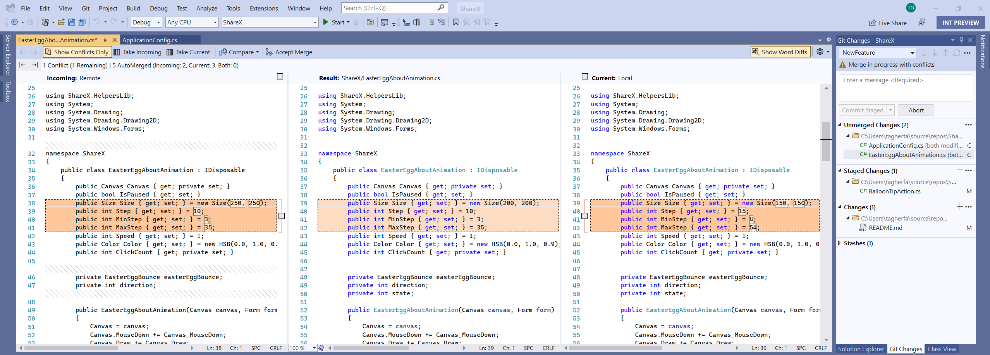
The Git integration in Visual Studio promotes trust and confidence by providing contextual assistance and prompting you to do the right thing. It also includes a conflict resolution experience (Figure 37) that can show/hide word differences and navigate between conflicts and differences (Figure 38).
Get Involved
This is just a sneak peak of the latest productivity features in Visual Studio 2022. To tap into more productivity features, you can visit the Visual Studio blog site https://devblogs.microsoft.com/visualstudio/. To install Visual Studio 2022, you can visit https://visualstudio.microsoft.com/vs/preview/. As always, let Microsoft know what you think by providing feedback on the Developer Community website https://aka.ms/devcomm or using the Report a Problem tool in Visual Studio.


