Although enterprises are gathering more data than ever, they may not be using it to their advantage. In most cases, companies don't even know what kind of information they possess or how to use it. This is where OpenTelemetry can help.
OpenTelemetry facilitates the collection and analysis of data from multiple sources simultaneously, enabling businesses to make more informed decisions about their operations. With OpenTelemetry, enterprises have transformed their approach to observability. OpenTelemetry is adept at troubleshooting, alerting, and debugging applications and is well poised to be the future of instrumentation.
OpenTelemetry includes a set of tools and libraries for distributed tracing and monitoring. It was created by the Cloud Native Computing Foundation (CNCF) to provide a standard way of instrumenting code for tracing. OpenTelemetry allows you to collect data about the flow of requests through your system and it can be used with any programming language. It has particularly good support for .NET.
The data collected can be used to generate a trace of how the requests were handled. This is useful for diagnosing performance issues or errors. In addition to .NET, there are libraries available for ASP.NET Core and other frameworks. These libraries make it easy to instrument your code and collect trace data. Overall, OpenTelemetry is a great tool for distributed tracing and monitoring. It's easy to use with .NET and it has good support for various frameworks.
This article talks about the concepts related to OpenTelemetry, why it's useful, and how you can work with it in ASP.NET 7 Core applications.
If you're to work with the code examples discussed in this article, you need the following installed in your system:
- Visual Studio 2022 Preview
- .NET 7.0
- ASP.NET 7.0 Runtime
If you don't already have Visual Studio 2022 Preview installed in your computer, you can download it from here: https://visualstudio.microsoft.com/downloads/.
In this article, you'll:
- Learn OpenTelemetry and its benefits
- Build a simple application in ASP.NET 7 Core
- Configure the application to provide support for OpenTelemetry
- Extend OpenTelemetry
- Build a custom processor
- Build a custom exporter
- Export telemetry data
- Understand the future of OpenTelemetry
What Is Distributed Tracing?
Distributed tracing is a method used to capture events across multiple services in order to troubleshoot issues and optimize performance. It's used to understand the execution of a distributed system and involves tracking the execution of each component in the system and recording information about each step. Using this information, the path taken by the system during execution can be recreated.
Distributed tracing can be used to identify bottlenecks in a system, or to understand the behavior of a complex distributed system. It can also be used to diagnose errors in a distributed system. This can help you understand how your application is performing and find root causes for any performance issues.
What Is Observability? Why Is It Important?
Observability refers to a system's ability to measure its current state from the data it generates, such as log files, metrics, and traces. Observability can improve operational visibility by capturing data and proactively observing distributed systems. It can identify relevant data based on how an application performs in a production environment over time.
Metrics, logging, and tracing are the three foundation elements of observability. I'll discuss each of these shortly.
What Is Open Telemetry? Why Should I Use It?
OpenTelemetry is an open-source distributed tracing framework for .NET 7. It uses the open-source framework for collecting, storing, and analyzing telemetry data (metrics, logs, and traces) and provides a high-level API for distributed tracing and metrics that can be used by applications in different environments including monoliths, microservices, and serverless applications.
OpenTelemetry is a .NET library for distributed tracing and metrics that was originally introduced in 2016 by Microsoft as part of the OpenTracing standard adopted by the OpenTracing Working Group at CNCF.
Since then, it's been widely adopted by various projects and companies across multiple industries, including Microsoft's own Azure services and Azure Functions. OpenTelemetry is a community-driven project, released under the Apache 2.0 license. It's available on GitHub and NuGet, and supports .NET Core 1.1 or higher, ASP.NET 5+, or any other .NET framework that implements the OpenTracing API.
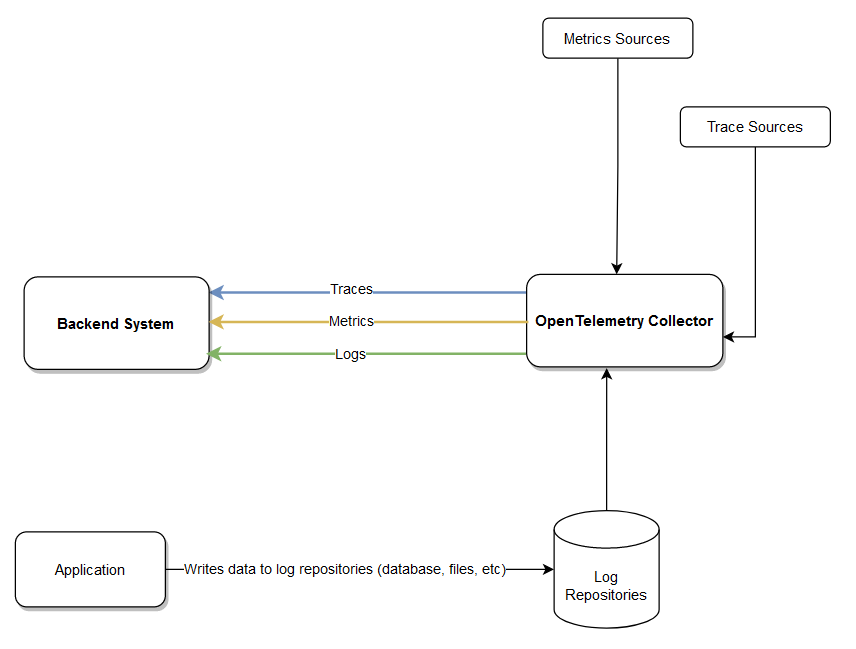
OpenTelemetry comprises a collection of APIs, SDKs, tooling, and integrations for collecting and storing telemetry data that includes traces, metrics, and logs. In OpenTelemetry, a collector is a component that receives, processes, and exports telemetry data, as shown in Figure 1.

OpenTelemetry can be used to correlate events that occur when your application is in execution. You can correlate events based on:
- Execution context: You can correlate logs and traces based on the traceId of an event.
- Execution time: You can correlate logs and traces based on the time of the event, i.e., when the event occurred.
- Telemetry Origin: You can correlate events based on the service name, the service instance, or the version of the service.
Why Open Telemetry?
OpenTelemetry is a new distributed tracing system designed to be used in a wide variety of programming languages and platforms. There are many benefits to using OpenTelemetry for distributed tracing, including:
- It is open source and well-supported by the community.
- It has good integration with other popular open-source tracing systems like Jaeger.
- It offers many features that make it simple to instrument your code and collect trace data.
- It has strong support for .NET and other Microsoft technologies.
If you're looking for a distributed tracing system to use in your .NET applications, OpenTelemetry is a great option to consider.
Components of OpenTelemetry
The OpenTelemetry collector has three components: receivers, processers, and exporters.
Receivers
An OpenTelemetry receiver collects data and sends it to a collector. A receiver can support one or more data sources and may be push- or pull-based. In the OpenTelemetry pipeline, receivers receive data in a specified format, convert it to an internal format, and pass it on to processors and exporters.
Processors
A processor is an optional component in the collector pipeline that processes data before sending it to an exporter. Using processors, you can batch-process, sample, transform, and enrich the telemetry data you receive from the collector before exporting it.
Exporters
OpenTelemetry can export telemetry data, such as metrics and traces, to several back-ends. An exporter can be push- or pull-based and is responsible for exporting data to one or more back-ends or destinations, such as Azure Monitor, Jaeger, Splunk, Prometheus, etc.
What Are Traces, Metrics, and Logs?
There are three main types of data that are important for understanding the performance of a system: tracing data, metrics, and logs.
Traces
Tracing is a process that records the details of all events. It captures data about the flow of a particular request or transaction across multiple components in your system, including information such as the event, event type, method calls, and exceptions raised. Tracing data is very useful for understanding how a system works and for finding bottlenecks.
Metrics
Metrics are numerical data that provide insights on the performance of an application, such as the number of requests per second, the average response time, and so on. For example, you could collect the average number of milliseconds it took to render a web page over time.
Metrics can be used to evaluate performance, capacity planning, or other aspects of an application's health. Metrics are very useful for understanding the overall performance of a system. The data captured includes specific events within certain boundaries of time, such as average response times or throughput rates.
Logs
Logs record events that occur when an application is in execution or information about how long a snippet of code or a method took to complete. This includes information about errors, warnings, and more. Logs are typically used for debugging and troubleshooting problems in an application.
These historical records describe events in an application during some period (i.e., user log-in and authentication). You can use logs to debug problems because they allow you to see what went wrong when an issue occurs, as shown in Figure 2.
Distributed Tracing Using Open Telemetry in ASP.NET 7
In this section, I'll examine how you can work with OpenTelemetry in an ASP.NET 7 application.
Create a New ASP.NET 7 Project in Visual Studio 2022
You can create a project in Visual Studio 2022 in several ways. When you launch Visual Studio 2022, you'll see the Start window. You can choose “Continue without code” to launch the main screen of the Visual Studio 2022 IDE.
To create a new ASP.NET 7 Project in Visual Studio 2022 Preview:
- Start the Visual Studio 2022 Preview IDE.
- In the “Create a new project” window, select “ASP.NET Core Web API” and click Next to move on.
- Specify the project name as OpenTelemetryDemo and the path where it should be created in the “Configure your new project” window.
- If you want the solution file and project to be created in the same directory, you can optionally check the “Place solution and project in the same directory” checkbox. Click Next to move on.
- In the next screen, specify the target framework as .NET 7 (Preview) and the authentication type as well. Ensure that the “Configure for HTTPS,” “Enable Docker Support,” and the “Enable OpenAPI support” checkboxes are unchecked because you won't use any of these in this example, as shown in Figure 3.
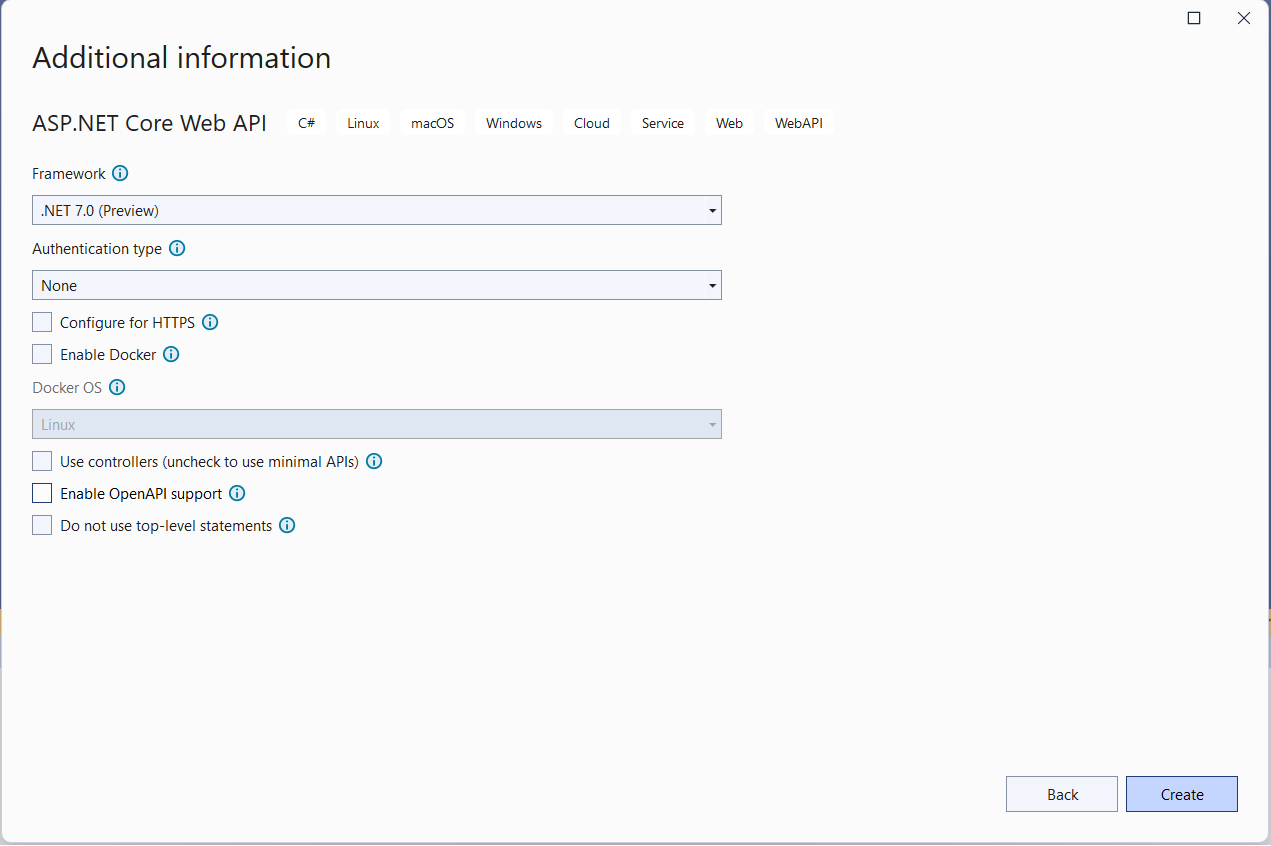
- Because you'll be using minimal APIs in this example, remember to uncheck the Use controllers (uncheck to use minimal APIs) checkbox.
- Click Create to complete the process.
You'll use this application in the subsequent sections in this article.
As the name suggests, a prerelease package is one that is still in development, is not yet fully tested, and has yet to be officially available as a stable version. For supporting the release lifecycle of a software product, NuGet provides a feature that allows it to work with prerelease packages. These packages are typically available between major releases.
You use prerelease packages when working with OpenTelemetry because these packages are constantly updated, and you can get the latest updates.
Install NuGet Package(s)
So far so good. The next step is to install the necessary NuGet Package(s) onto your project. You can install the required packages from the Developer Command Prompt for VS 2022 Preview by executing the following commands:
dotnet add package --prerelease OpenTelemetry.Exporter.Console
dotnet add package --prerelease OpenTelemetry.Extensions.Hosting
dotnet add package --prerelease OpenTelemetry.Instrumentation.AspNetCore
The OpenTelemetry.Exporter.Console package is used for printing telemetry data at the developer console in your local computer. The OpenTelemetry.Extensions.Hosting package contains the extension methods to register OpenTelemetry into the applications using Microsoft.Extensions.DependencyInjection and Microsoft.Extensions.Hosting. The OpenTelemetry.Instrumentation.AspNetCore package is an instrumentation library that tracks the inbound web requests and collects telemetry data.
You can also install the packages inside the Visual Studio 2022 IDE by running the following commands at the NuGet Package Manager Console:
Install-Package --prerelease OpenTelemetry.Exporter.Console
Install-Package --prerelease OpenTelemetry.Extensions.Hosting
Install-Package --prerelease OpenTelemetry.Instrumentation.AspNetCore
You'll also be able to install these packages using the NuGet Package Manager window inside the Visual Studio 2022 Preview IDE. To install the required packages into your project, right-click on the solution and then select Manage NuGet Packages for Solution…. Now search for these packages one at a time in the search box and install them.
Implementing OpenTelemetry in ASP.NET 7 Core
In this section, I'll examine how you can take advantage of OpenTelemetry in ASP.NET 7 Core. You'll use the application you created earlier to add support for telemetry data.
Add Support for Tracing
To add support for tracing in your application, you can write the following code in the Program.cs file:
builder.Services.AddOpenTelemetryTracing((builder) => builder
    .SetResourceBuilder(ResourceBuilder.CreateDefault()
      .AddService("MyDemoService"))
    .AddAspNetCoreInstrumentation()
    .AddHttpClientInstrumentation()
    .AddConsoleExporter());
Add Support for Metrics
The following code snippet illustrates how you can add metrics to your application:
builder.Services.AddOpenTelemetryMetrics(builder => builder.SetResourceBuilder(
    ResourceBuilder.CreateDefault()
        .AddService("MyDemoService"))
      .AddAspNetCoreInstrumentation()
      .AddConsoleExporter());
Add Support for Logging
To add support for logging in your application, you can use the code snippet given below:
builder.Host.ConfigureLogging(builder => builder.ClearProviders()
    .AddOpenTelemetry(options =>
    {
        options.IncludeFormattedMessage = true;
        options.SetResourceBuilder(ResourceBuilder.CreateDefault().
            AddService("MyDemoService"));
        options.AddConsoleExporter();
    }));
The complete source code of the Program.cs file is given in Listing 1 for your reference.
Listing 1: The complete source code of the Program.cs file
using OpenTelemetry;
using OpenTelemetry.Logs;
using OpenTelemetry.Metrics;
using OpenTelemetry.Resources;
using OpenTelemetry.Trace;
using OpenTelemetryDemo;

var builder = WebApplication.CreateBuilder(args);

builder.Services.AddControllers();
builder.Services.AddEndpointsApiExplorer();
builder.Services.AddSwaggerGen();

builder.Services.AddOpenTelemetryTracing
  ((builder) => builder.SetResourceBuilder(ResourceBuilder.CreateDefault()
      .AddService("MyServiceName"))
            .AddAspNetCoreInstrumentation()
            .AddHttpClientInstrumentation()
            .AddMyConsoleExporter()
  );

    // Add support for tracing
    builder.Services.AddOpenTelemetryTracing((builder) => builder
        .SetResourceBuilder(ResourceBuilder
        .CreateDefault().AddService("MyDemoService"))
        .AddAspNetCoreInstrumentation()
        .AddHttpClientInstrumentation()
        .AddConsoleExporter()
    );

    // Add support for metrics
    builder.Services.AddOpenTelemetryMetrics(builder => builder
        .SetResourceBuilder(ResourceBuilder
        .CreateDefault().AddService("MyDemoService"))
        .AddAspNetCoreInstrumentation()
        .AddConsoleExporter()
    );

    // Add support for logging
    builder.Host,ConfigureLogging(builder => builder
        .ClearProviders()
        .AddOpenTelemetry(options =>
        {
            options.IncludeFormattedMessage = true;
            options.SetResourceBuilder(ResourceBuilder
            .CreateDefault().AddService("MyDemoService"));
            options.AddConsoleExporter();
        }));

builder.Services.AddControllers();
builder.Services.AddEndpointsApiExplorer();
builder.Services.AddSwaggerGen();

var app = builder.Build();

// Configure the HTTP request pipeline
if (app.Environment.IsDevelopment())
{
    app.UseSwagger();
    app.UseSwaggerUI();
}

app.UseHttpsRedirection();
app.UseAuthorization();
app.MapControllers();

app.Run();
A Real-World Use Case
In this section, you'll implement a simple order processing application. To keep things simple, this application only displays one or more order records. The source code of this application contains the following classes and interfaces:
- Order class
IOrderRepositoryinterfaceOrderRepositoryclassOrdersControllerclass
Create the Model Class
Create a new class named Order in a file having the same name with a .cs extension, and write the following code in there:
public class Order
{
    public int Id { get; set; }
    public int CustomerId { get; set; }
    public int ProductId { get; set; }
    public decimal UnitPrice { get; set; }
    public int OrderQuantity { get; set; }
    public decimal Amount { get; set; }
    public DateTime OrderDate { get; set; }
}
The Product and Customer classes aren't being shown here for brevity and also because this is a minimal implementation to illustrate how you can work with OpenTelemetry in ASP.NET 7 Core.
Create the OrderRepository Class
Now, create a new class named OrderRepository in a file having the same name with a .cs extension. Now write the following code in there:
public class OrderRepository : IOrderRepository
{

}
The OrderRepository class illustrated in the code snippet below implements the methods of the IorderRepository interface. Here is how the IorderRepository interface should look:
public interface IorderRepository
{
    public Task<List<Order>> GetAllOrders();
    public Task<Order> GetOrder(int Id);
}
The OrderRepository class implements the two methods of the IorderRepository interface:
public async Task<List<Order>> GetOrders()
{
    return await Task.FromResult(orders);
}

public async Task<Order> GetOrder(int Id)
{
  return await Task.FromResult(orders.FirstOrDefault(x => x.Id == Id));
}
The complete source code of the OrderRepository class is given in Listing 2.
Listing 2: The OrderRepository class
public class OrderRepository : IOrderRepository
{
    private readonly List<Order> orders = new List<Order>
    {
        new Order
        {
            Id = 1,
            ProductId = 1,
            CustomerId = 2,
            OrderQuantity = 10,
            UnitPrice = 12500.00m,
            Amount = 125000.00m,
            OrderDate = DateTime.Now
        },
        new Order
        {
            Id = 2,
            ProductId = 2,
            CustomerId = 1,
            OrderQuantity = 20,
            UnitPrice = 10000.00m,
            Amount = 200000.00m,
            OrderDate = DateTime.Now
        },
        new Order
        {
            Id = 3,
            ProductId = 3,
            CustomerId = 3,
            OrderQuantity = 50,
            UnitPrice = 15000.00m,
            Amount = 750000.00m,
            OrderDate = DateTime.Now
        }
    };
    public async Task<List<Order>> GetOrders()
    {
        return await Task.FromResult(orders);
    }
    public async Task<Order> GetOrder(int Id)
    {
        return await Task.FromResult(orders.FirstOrDefault(x => x.Id == Id));
    }
}
Register the OrderRepository Instance with IserviceCollection
The following code snippet illustrates how an instance of type IorderRepository is added as a scoped service to the IserviceCollection.
Builder.Services.AddScoped<IorderRepository, OrderRepository>();
The complete source code of the Program.cs file is given in Listing 3.
Listing 3: The complete source of Program.cs file
using OpenTelemetry;
using OpenTelemetry.Logs;
using OpenTelemetry.Metrics;
using OpenTelemetry.Resources;
using OpenTelemetry.Trace;
using OpenTelemetryDemo;

var builder = WebApplication.CreateBuilder(args);

builder.Services.AddControllers();
builder.Services.AddEndpointsApiExplorer();
builder.Services.AddScoped<IOrderRepository, OrderRepository>();

builder.Services.AddOpenTelemetryTracing((builder) => Builder
            .SetResourceBuilder(ResourceBuilder
            .CreateDefault().AddService("MyServiceName"))
            .AddAspNetCoreInstrumentation()
            .AddHttpClientInstrumentation()
            .AddMyConsoleExporter()
);

// Configure tracing
builder.Services.AddOpenTelemetryTracing((builder) => Builder
            .SetResourceBuilder(ResourceBuilder
            .CreateDefault().AddService("MyDemoService"))
            .AddAspNetCoreInstrumentation()
            .AddHttpClientInstrumentation()
            .AddConsoleExporter()
);

// Configure metrics
builder.Services.AddOpenTelemetryMetrics(builder => builder
            .SetResourceBuilder(ResourceBuilder
            .CreateDefault().AddService("MyDemoService"))
            .AddAspNetCoreInstrumentation()
            .AddConsoleExporter()
);

// Configure logging
builder.Host.ConfigureLogging(builder => builder
            .ClearProviders()
            .AddOpenTelemetry(options =>
                {
                    options.IncludeFormattedMessage = true;
                    options.SetResourceBuilder(ResourceBuilder.CreateDefault()
                        .AddService("MyDemoService"));
                    options.AddConsoleExporter();
                }
            )
);

builder.Services.AddControllers();
builder.Services.AddEndpointsApiExplorer();
var app = builder.Build();

// Configure the HTTP request pipeline
app.UseHttpsRedirection();
app.UseAuthorization();
app.MapControllers();

app.Run();
The OrderController Class
Lastly, create a new API controller class named OrderController in your project with the code given in Listing 4 in there. The OrdersController class contains two action methods. Although the GetOrders action method returns a list of Order instances, the GetOrder action method returns one Order based on the Order ID passed to the action method as a parameter. The GetOrders and GetOrder action methods call the GetOrders and GetOrder methods of the OrderRepository class respectively. An instance of type IorderRepository is injected into the OrdersController using constructor injection.
Listing 4: The OrderController class
[Route("api/[controller]")]
[ApiController]
public class OrdersController : ControllerBase
{
    private IOrderRepository _orderRepository;
    public OrdersController(IOrderRepository orderRepository)
    {
        _orderRepository = orderRepository;
    }

    [HttpGet("GetOrders")]
    public async Task<List<Order>> GetOrders()
    {
        return await _orderRepository.GetOrders();
    }

    [HttpGet("{id}")]
    public async Task<Order> GetOrder(int id)
    {
        return await _orderRepository.GetOrder(id);
    }
}
Executing the Application
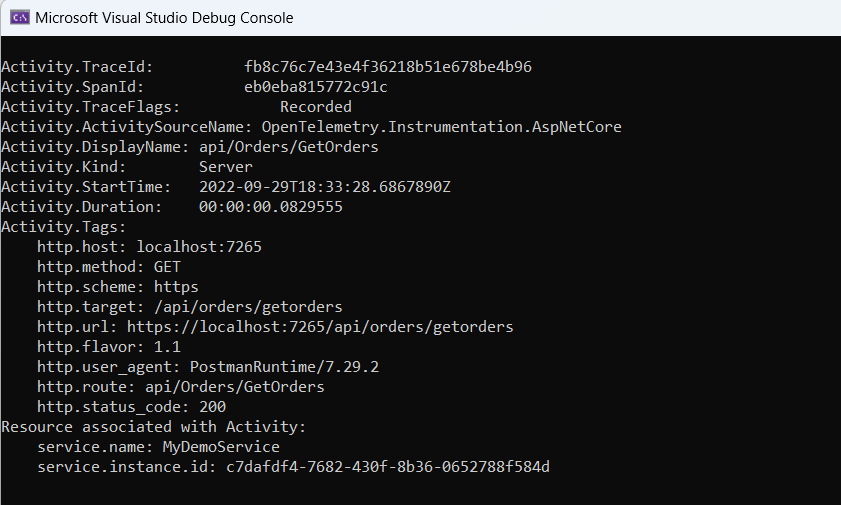
When you run the application, you'll be able to see telemetry data displayed at the console window, as shown in Figure 4:
Extending the OpenTelemetry .NET SDK
In this section, I'll examine how to extend the OpenTelemetry .NET SDK. You'll see how you can build a custom exporter and a custom processor.
Building Your Custom Exporter
You might often want to build custom exporters to send telemetry data to destinations not supported by built-in exporters.
Your custom exporter is a C# class that extends the BaseExporter class of the OpenTelemetry library, as shown in the code snippet given below:
class MyConsoleExporter : BaseExporter<Activity>{
    public override ExportResult Export (in Batch<Activity> batch)
    {
        using var scope = SuppressInstrumentationScope.Begin();
        Console.WriteLine("Displaying telemetry data:-");
        foreach (var activity in batch)
        {
            Console.WriteLine($"Activity Id: {activity.Id}");
            Console.WriteLine($"Trace Id: {activity.TraceId.ToString()}");
            Console.WriteLine($"Display Name: {activity.DisplayName}");
        }
        return ExportResult.Success;
    }
}
Here's how you can add your custom exporter in the Program.cs file:
builder.Services.AddOpenTelemetryTracing((builder) => builder
    .SetResourceBuilder(ResourceBuilder.CreateDefault()
      .AddService("MyServiceName"))
    .AddAspNetCoreInstrumentation()
    .AddHttpClientInstrumentation()
    .AddMyConsoleExporter()
);
When you execute the application and hit the GetOrders endpoint, the activity details will be displayed at the developer console window, as shown in Figure 5.

Build a Custom Processor
To create a custom processor, create a C# class that extends the BaseProcessor class of the OpenTelemetry library, as shown in the code snippet given below:
class MyProcessor : BaseProcessor<Activity>
{
    public override void OnStart(Activity activity)
    {
        Console.WriteLine($"OnStart called:{activity.DisplayName}");
   }

   public override void OnEnd(Activity activity)
   {
        Console.WriteLine($"OnEnd called:{activity.DisplayName}");
   }
}
Export Telemetry Data
OpenTelemetry data can be exported to back-ends using trace exporters. Some of the popular trace exporters available are:
- Jaeger
- Zipkin
- OLTP gRPC
- OLTP HTTP
In this example, you'll examine how you can export telemetry data using Jaeger. To export your telemetry data using Jaeger, here's what you'll need to do:
- Install Docker Desktop from here: https://www.docker.com/products/docker-desktop/.
- Install the
OpenTelemetry.Exporter.JaegerNuGet package. - Configure Jaeger Exporter in the
Program.csfile. - Use Docker-Compose to Start Jaeger.
Install the OpenTelemetry.Exporter.Jaeger NuGet Package
You can install the OpenTelemetry.Exporter.Jaeger package from the Developer Command Prompt for VS 2022 Preview by executing the following commands:
dotnet add package --prerelease OpenTelemetry.Exporter.Jaeger
You can also install the package from the NuGet Package Manager windows inside the Visual Studio 2022 Preview IDE.
Configure Jaeger Exporter in the Program.cs file
Now, replace the code you wrote earlier to enable OpenTelemetry tracing using the following piece of code:
builder.Services.AddOpenTelemetryTracing((builder) => builder.SetResourceBuilder
    (ResourceBuilder.CreateDefault().AddService("MyDemoService"))
        .AddAspNetCoreInstrumentation()
        .AddJaegerExporter()
);
This allows you to export your telemetry trace data using Jaeger. The call to the AddAspNetCoreInstrumentation method enables ASP.NET Core instrumentation for your application at application startup.
Use Docker-Compose to Start Jaeger
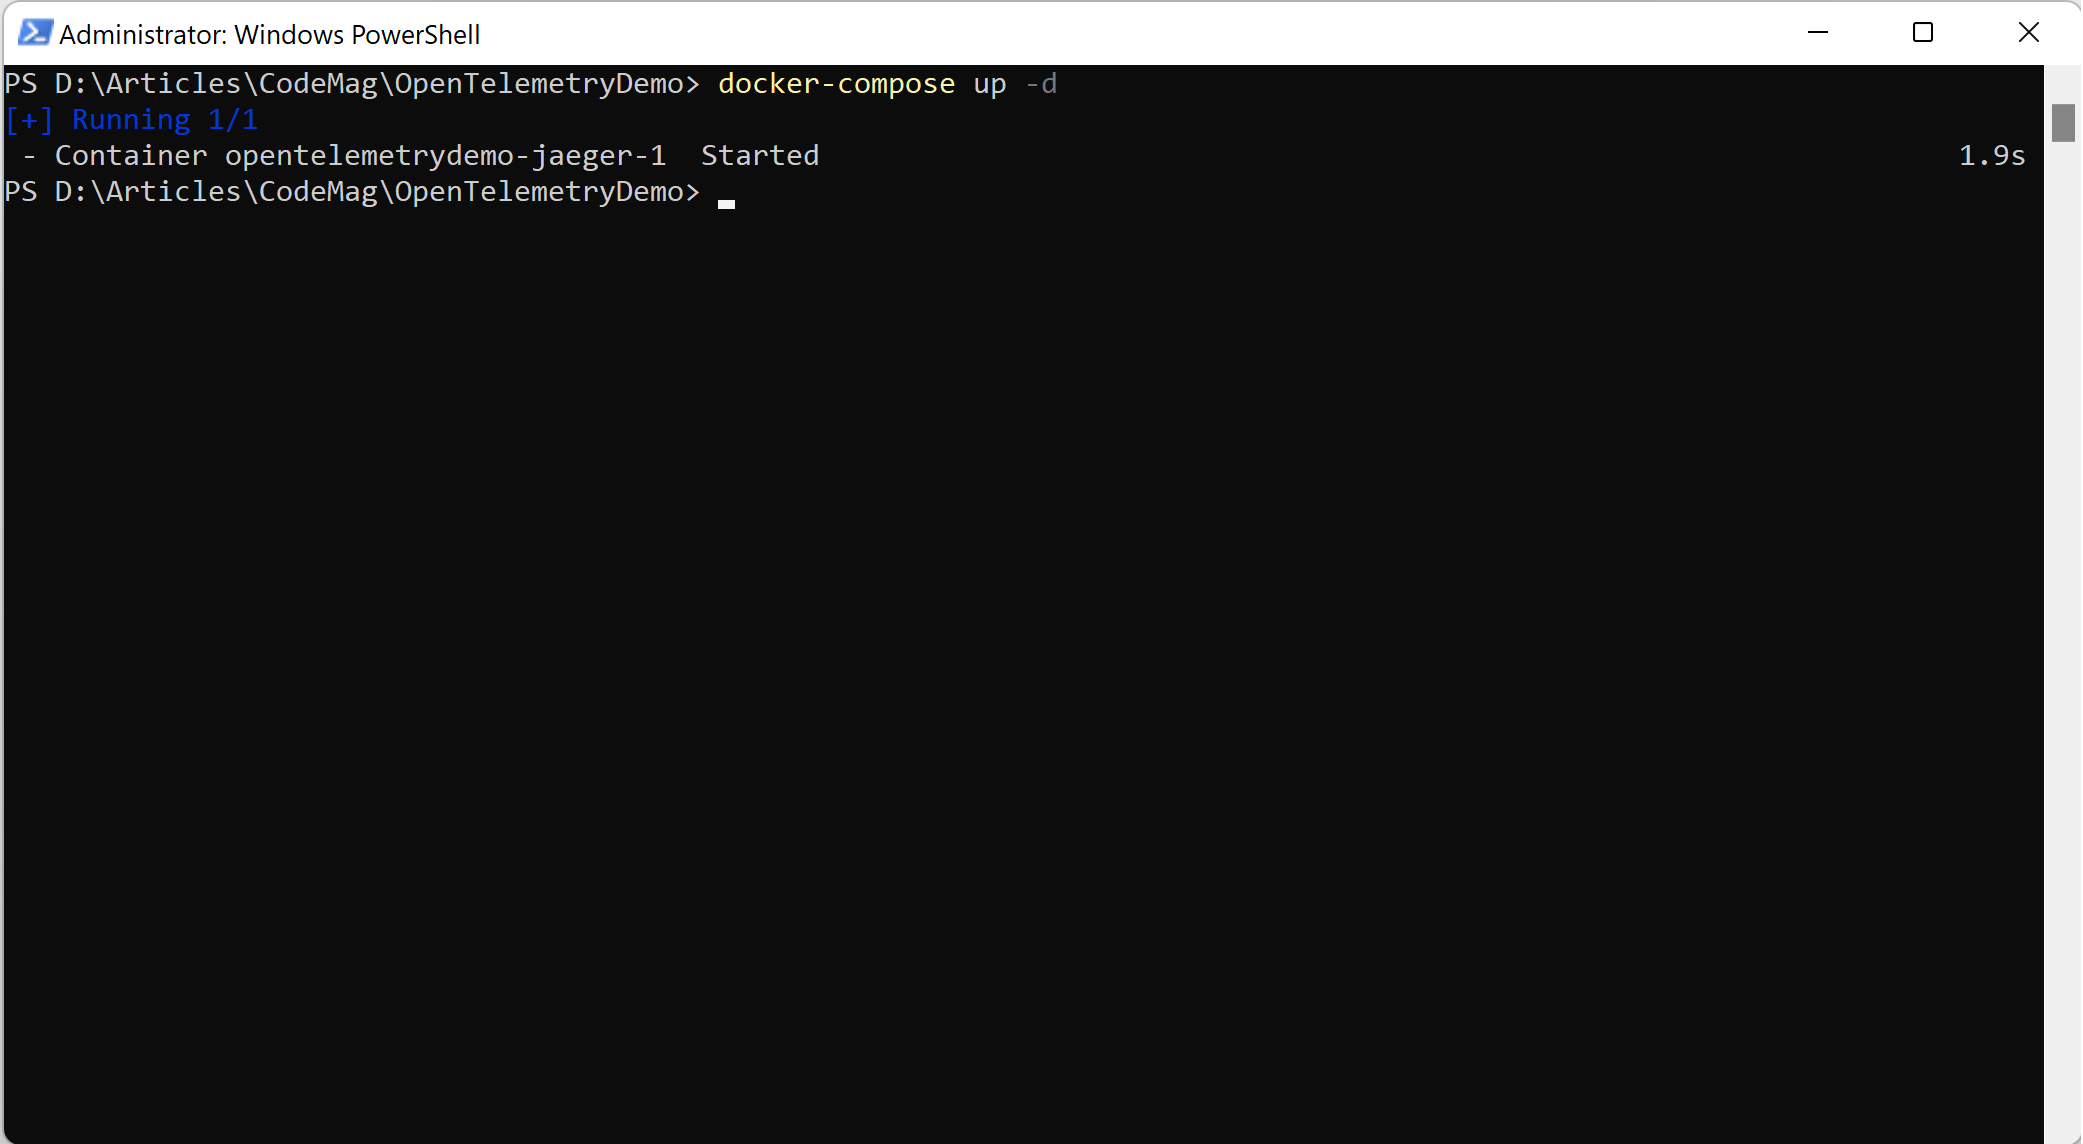
Assuming Docker Desktop is already running in your system, you can use the following command to start Jaeger:
docker-compose up -d
You can write the above command in a PowerShell window or a Command window. In either case, ensure that you open the windows in administrator mode, as shown in Figure 6.
The Jaeger UI
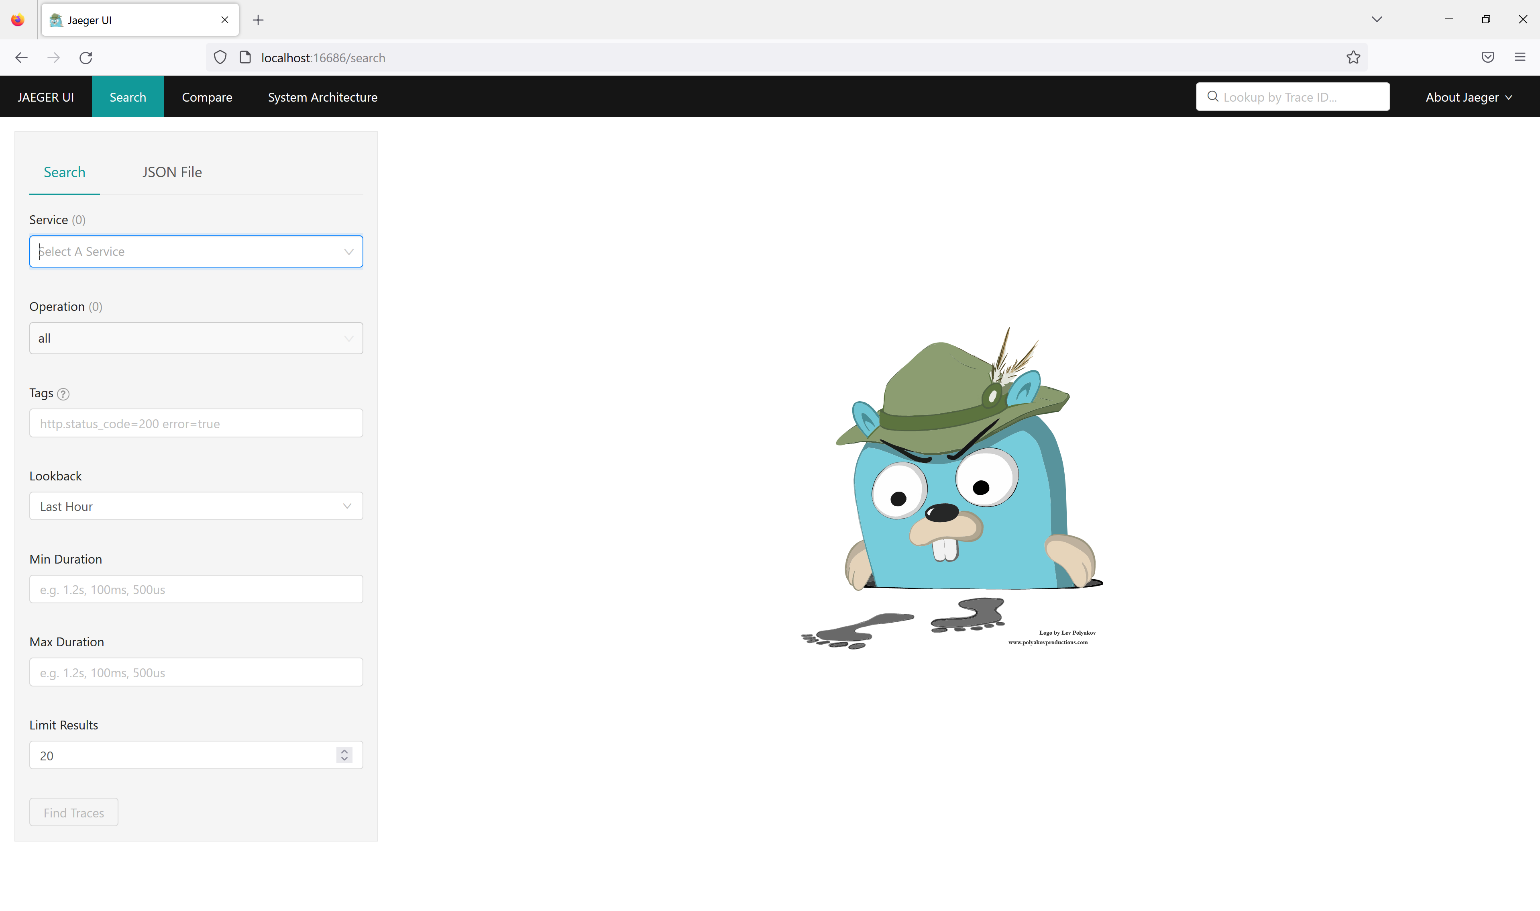
Assuming that Jaeger started successfully, you can browse the default URL of the Jaeger UI, as shown in Figure 7. By default, the Jaeger UI can be viewed at http://localhost:16686.
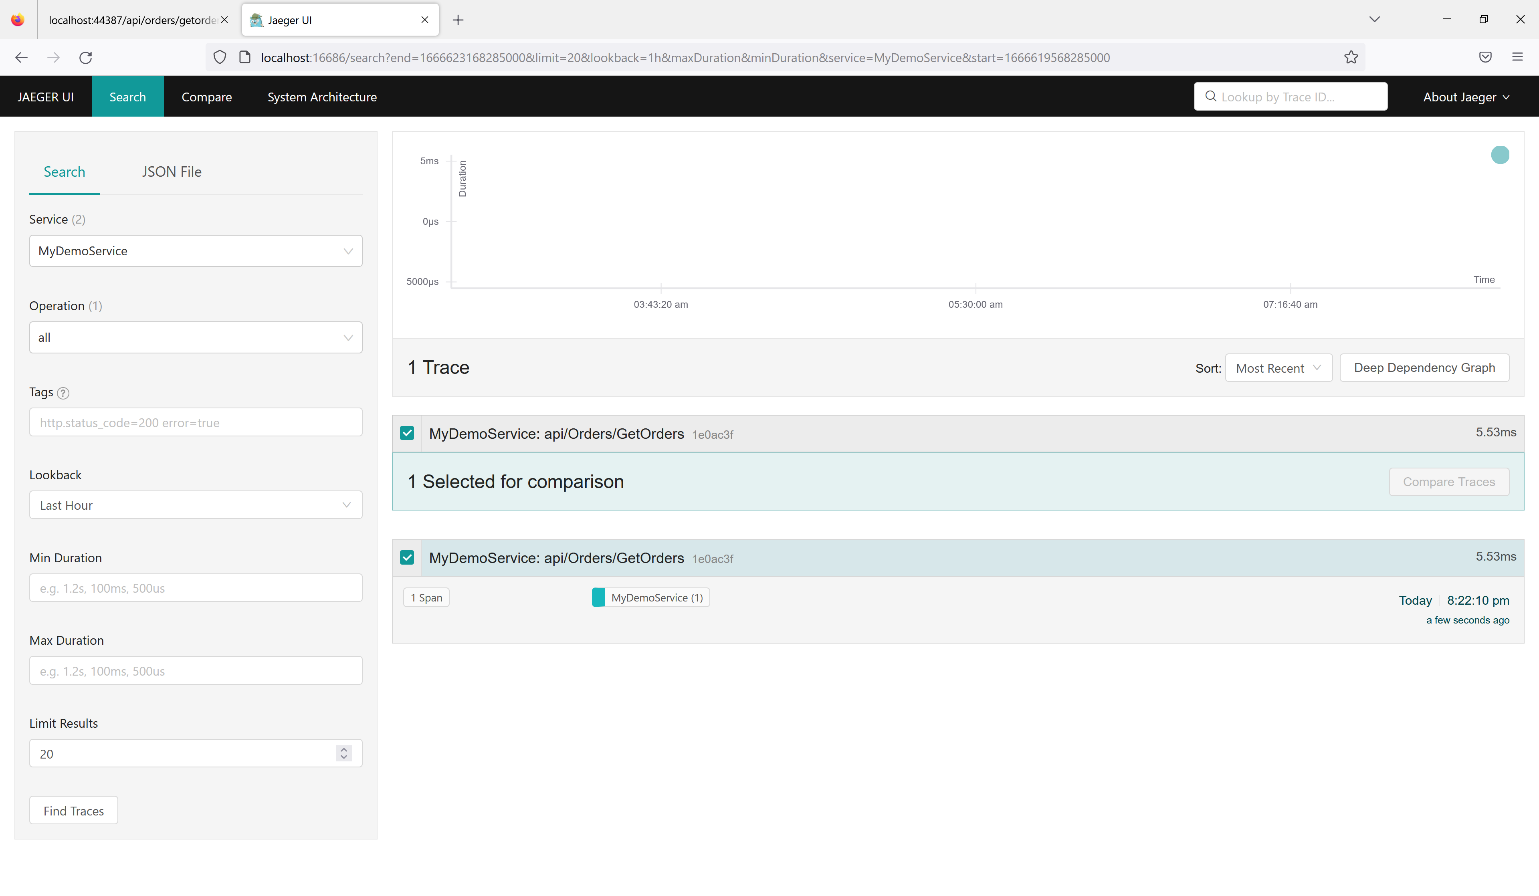
Finally, execute your application in a web browser. You can now see the traces in the Jaeger UI for your service, as shown in Figure 8:
Conclusion
OpenTelemetry is an open-source project that provides tools for distributed tracing. It includes libraries for different programming languages, including .NET. OpenTelemetry can be used to prepare applications for distributed tracing. It also provides a set of APIs that can be used to collect trace data from a variety of sources.


